
Economic Update Feb 2012
 •
by
•
by Paul J Keating
Since my last economic update a couple of things have changed. Firstly thanks to the great work by Mudkip McMudkip (who wrote the scripts) and Xavier Griffith (who arranged the hosting) the data I am using is downloaded from the Australian Bureau of Statistics data store. Rather than collecting data manually I can now get stats of hourly price updates, this makes my life easier and also helps to smooth out bumps in the data as the daily prices are now the average of these hourly checks rather than individual records. I’m still collecting salary data manually, and have to calculate the taxes that apply to the post-tax prices supplied by the API, but all in all this is a fantastic improvement!
I’m also quite excited to have been appointed deputy minister of finance in the Larni cabinet, working with minister James Keane and adviser venja, so you may now consider these economic updates somewhat ‘official’ (though in reality nothing has changed).
GENERAL OBSERVATIONS
The economic situation is also showing signs of change since my last update. Previous months had seen very stable food and weapon prices with gradual salary increases improving citizen well-being. While salaries are still on the rise, we’re now starting to see some price inflation. It’s too early to tell whether this is a temporary ‘blip’, a cyclical change or the beginning of something larger. Inflation is not necessarily a bad thing, depending on the cause. It could be that the economic growth we’ve seen over the past few months may be stretching productive capacity, though I think this is highly unlikely as we have just been through an upgrade offer that would have resulted in a spike in investment. Though I don’t keep records of currency markets it seems the Gold/AUD exchange rate is higher than normal and the inflation could be an adjustment to a currency depreciation, or potentially higher global prices.
This is also a good time to take a snapshot as the senate is currently revising tax policy. Income tax has just been cut from 15% to 10%, while there is a proposal for a similar reduction in VAT in discussion as I write this article. These changes are great news for workers, company owners and consumers and will more than account for any minor bout of inflation.
Now down to the individual markets.
WEAPONS

Weapons prices by quality
While prices in the lower end of the market remain stable, there is a slight upward trend in the Q3-6 market (with the exception of Q5 which is uncertain). The trend is only slight and something to observe rather than worry about.
FOOD

Food prices by quality
Though it isn’t immediately evident from the chart, food prices have seen steady increases over the period when considered as cost per health (see chart below). The key markets to watch here are Q2 and Q3 which are typically the best value for money. Both of these markets are trending upwards, consistent with the inflation seen in weapons markets.
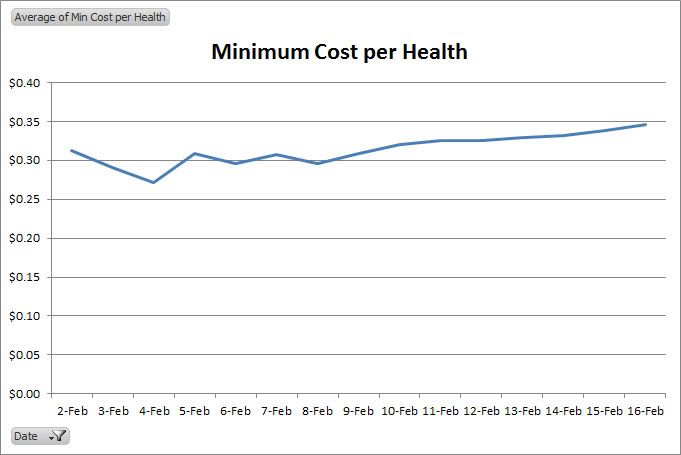
Minimum cost per health
This graph represents the cost per health unit buying the best value food offer on the market. Here the trend is very clear, a steady increase from around the $0.30 mark creeping toward $0.35, definitely something to watch.
SALARIES
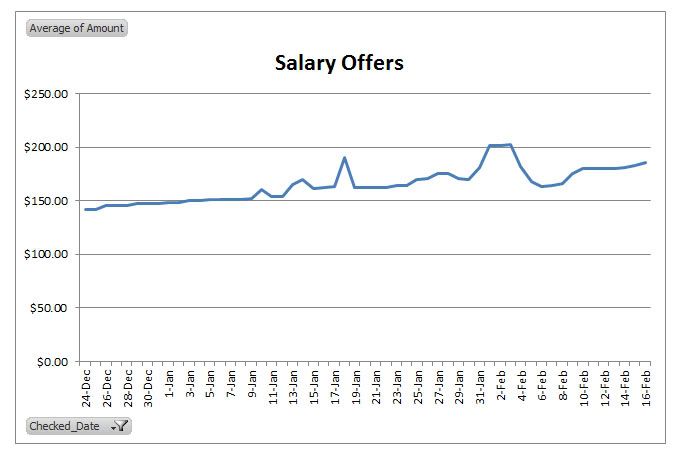
Highest daily salary offer
Note that this chart extends over a longer period than the price charts as I’ve been collecting it manually for a longer period. It is also updated once per day (rather than once per hour) so will likely show higher volatility than the price data.
Clearly salaries have been steadily rising over the past few months, though growth during February has been somewhat constrained.
MAXIMUM HEALTH PER DAY

Maximum health that may be purchased from the highest daily salary offer
This chart shows how much health can be recovered per day working at highest market salary rate while purchasing the best value for money food offer, a key indicator of economic health for new citizens. I have adjusted this slightly from previous updates where I (mistakenly) used gross salary rather than net salary (i.e. post-tax) in calculations. This update will allow us to evaluate the effect of the income tax reduction recently approved by senate (but not yet included in the data).
Not great news in this chart unfortunately, over the short period the maximum recoverable health shows a definite downward trend indicating that salary growth has not kept pace with price inflation. The income tax reduction should see higher net salary, and should VAT also be decreased prices should also be relatively lower. It will be interesting indeed to monitor the effect of these changes as they occur.
That’s all for this update. Thanks again to Mudkip McMudkip and Xavier Griffith for making the data collection much easier and more accurate.
Comments
lots of work for you! cheers mate, hope to have you long time with us!
Always nice to see these. A succinct summary of our Economic situation.
Sheer brilliance!
Excellent
Keep up the good work.
GJ PK