
CP Election: Results Graph
 •
by
•
by Matthew.Cox
It was suggested in a comment on one of my earlier articles that I should draw up a graph of the results of the election, which is exactly what I've done. But I'd first like to compare my poll graph which was thoroughly flawed with the graph for the election results:
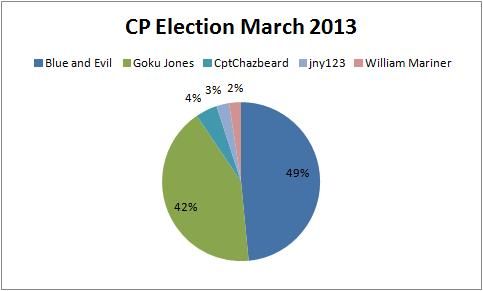
This is the graph of the actual election result, which is this:
Compare it to the graph of my poll results:
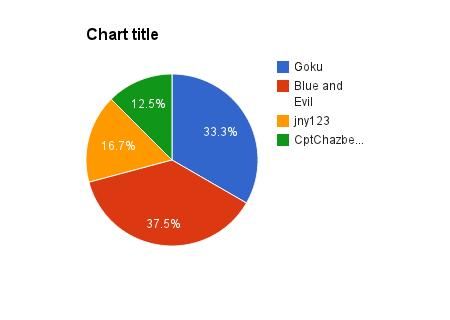
So, more or less correct about the two front runners which I think everyone has expected all along anyway, but was wrong about the other three candidates: CptChazbeard did better than jny123 and William Mariner actually got some votes, though the flaws of my poll are briefly explained in one of my earlier articles. So, overall, pretty pictures of things you already understood. Could be worse.
Comments
first
Voted (already subbed) o/
When you consider that people may suggest support but tend to go for the top two candidates come election day; the results in the pre-election graph are remarkably close to spot on. Great job!
(Us in the bottom three tend to be protest votes and a few loyal followers so it's hard to tell how they'll pan out)
Loyal Follower right here o7
Consider the Minister of Finance & Security of Orgs (with money in them) yours Sir!
I make sure they iz safe...
Keep up the good work and looks like you poll was correct with the result. I hope you'll do more in the future
Statistically it's a coincidence. But what do I know? I'm just a mathematian.
I pointed out in this article, like my last poll article, the problems with my poll. It may well be a coincidence, just as it may be not be. Perhaps (and as a mathematician) you'd know that it's possible - not likely, but possible - for the people surveyed in the poll to be of an even demographic distribution. I'm frankly quite tired of having to repeat myself over and over to you, and as a matter of fact you're the only hostile player I've come across in my short time here. Not exactly leading the charge for retention. Rant over.
I make the same comments on every poll/census article and I'm not providing interview content for a hostile party. I don't think that is unreasonable.
If we are seen as hostile then it is from your end only Goku and that hostility will not be returned : )
[removed]
As you are apparently a mathematician you should probably start applying the correct maths to the correct situations.
Sorry Carlini that I am threatening your job by having real subject knowledge and qualifications.
Threatening nothing. I know your job and your qualifications. Like I said, start using it properly.
Vauge no substance insutls.
Claim to be a mathematician in another thread and then use it completely wrong. That isn't my fault, not even an insult, just asking for you to use it right if you are a mathematician.
voted
voted & subbed
what was the total response to your poll? that may give an indication of why its skewed. if the poll number is higher than the actual votes cast then it could be a number who responded didn't bother to vote, or changed their minds at the last minute. if it's the other way around, you could say your sample is flawed, as most pre-election polls, and some exit-polls, are. as Disraeli once said "there are lies, damned lies, and statistics" (or words to that effect if he was misquoted in what I've read) so you have to look at the conditions of the poll. good effort nonetheless .. o7