
[Statistics] All Countries Markets Analysis Week 17
Day 1,625, 11:06
•
Published in Portugal  •
by
•
by
 •
by
•
by jotapelx

Hello,
Today I'm finishing the analysis for this week series with the market ranking. After the series of data from the market-watch I was able to gather some consistent information regarding our markets, by country and from that I can extrapolate to the Alliances. I've tried to retrieve the data everyday at around 3:00 (eRepublik Time). Sometimes it was a bit earlier, and sometimes a bit later (it is dependent of my RL work).
We will look into the Market Ranking by country. We will look into the average best prices for each Alliance and Big Alliance.
This week, since I have more past record of the evolution of those prices I will include the values from the last 2 weeks and we will look into the evolution of those prices by each Alliance and by Country Size comparing with the data from the eRepublik Commonwealth (France, Germany, Ireland and Portugal). All values are net without VAT, or income tax for the jobs market.
The mapping of each country to the respective Alliance was done in this article http://www.erepublik.com/en/article/-statistics-alliances-swing-of-regions-week-14-2005398/1/20 for this week series.
Since the countries in each alliance are not really homogeneous I've tried to create a more meaningful aggregation by population size:
-Large Countries with an Active Population bigger than 4000;
-Medium Countries with an Active Population between 1000 and 4000;
-Small Countries with an Active Population lower than 1000
The baseline data of these statistics is from day 1622, 03:00. The markets data is from day 1615 until day 1622 at around 02:00 (eRepublik Time) and the timeline evolution data is from day 1611 until day 1625 at around 03:00 (eRepublik Time)

The ranking is described in detail in this article http://www.erepublik.com/en/article/-statistics-country-markets-analysis-week-12-1994779/1/20
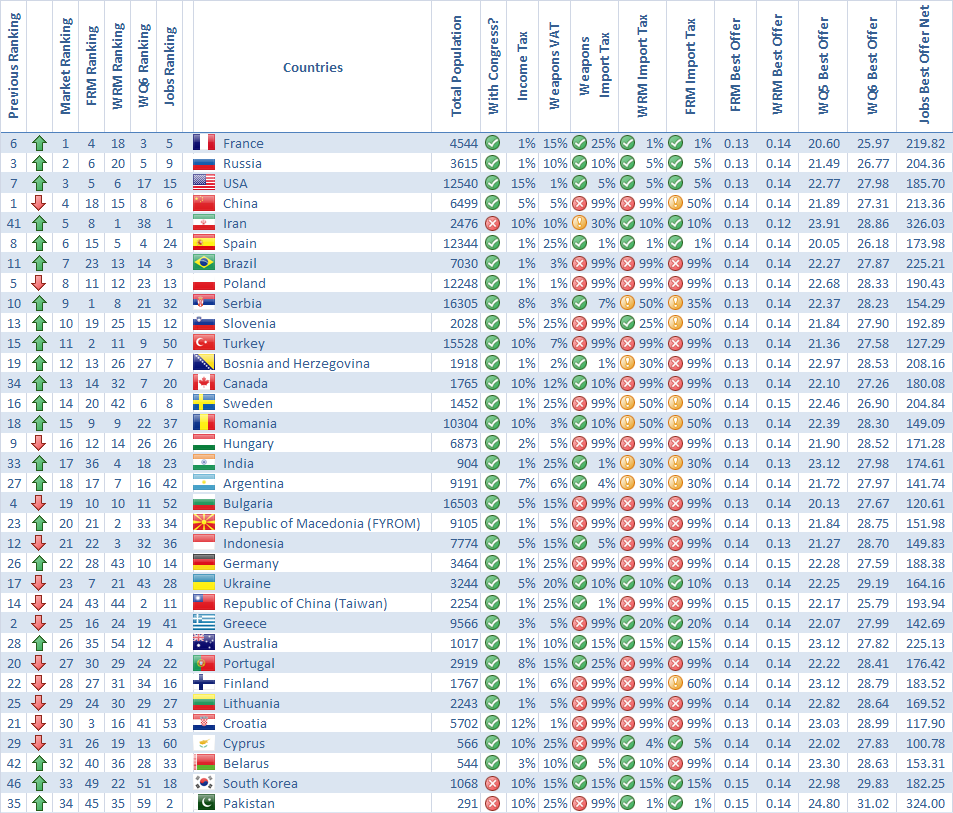
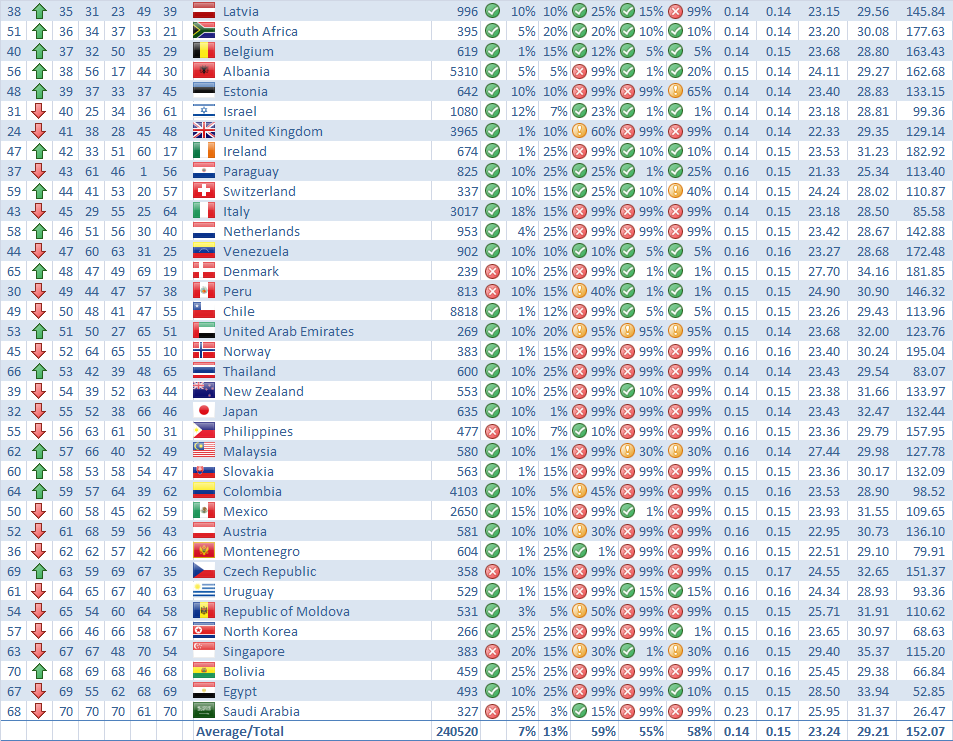
In the next charts we will look into the data by each Alliance and by Country Size for each market.

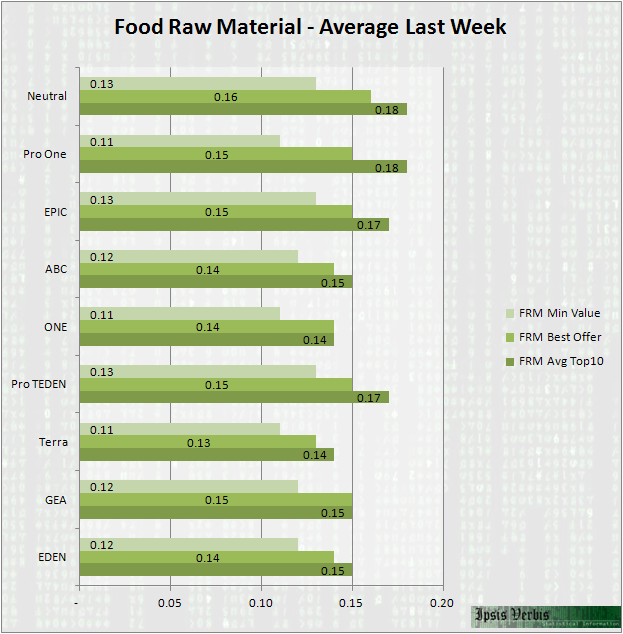
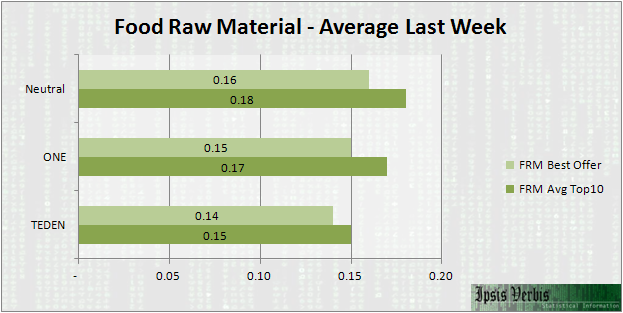
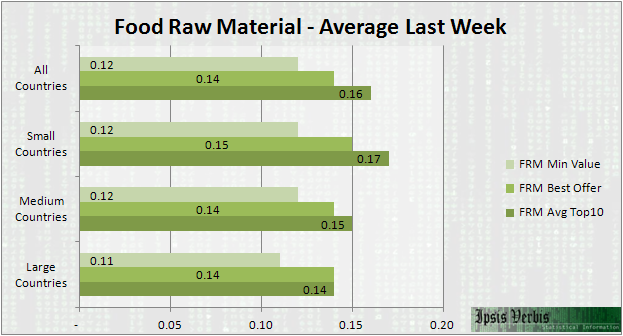
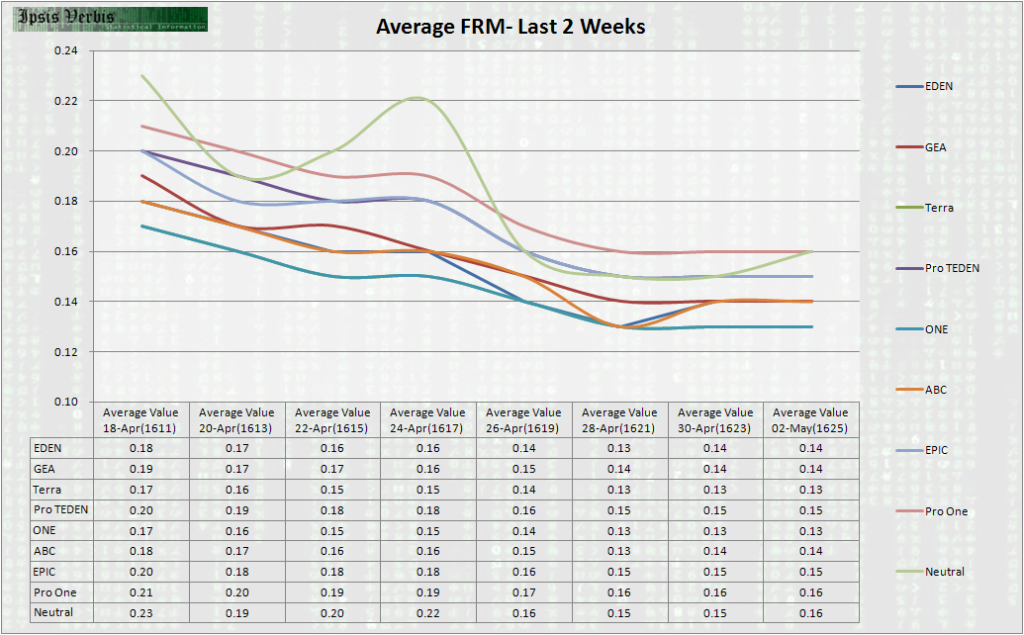
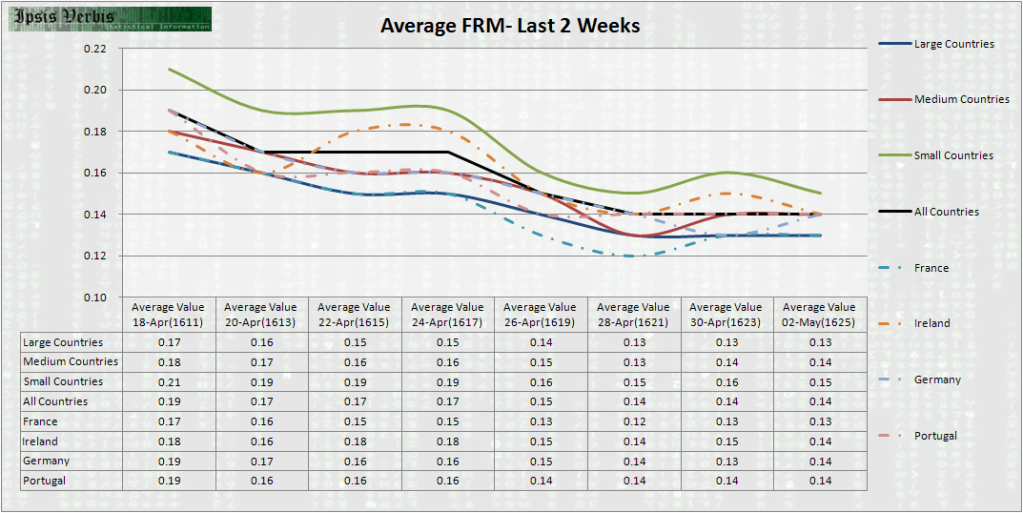
The Food Raw Material has been lowering their value significantly in the past weeks. The timeline evolution gives a more accurate idea of the drop of the price.
The following chart is the average value for each alliance concerning Food Raw Material:
By Big Alliances we have:
By Size we have:
The timeline evolution of prices for each Alliance:
The timeline evolution of prices aggregated by Country Size and the Commonwealth Countries in the backgroun
😛

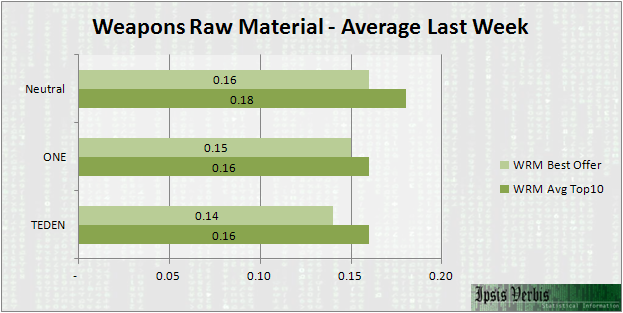
The Weapons Raw Material has been lowering their value significantly in the past weeks. The timeline evolution gives a more accurate idea of the drop of the price.
The following chart is the average value for each alliance concerning Weapons Raw Material:

By Big Alliances we have:
By Size we have:

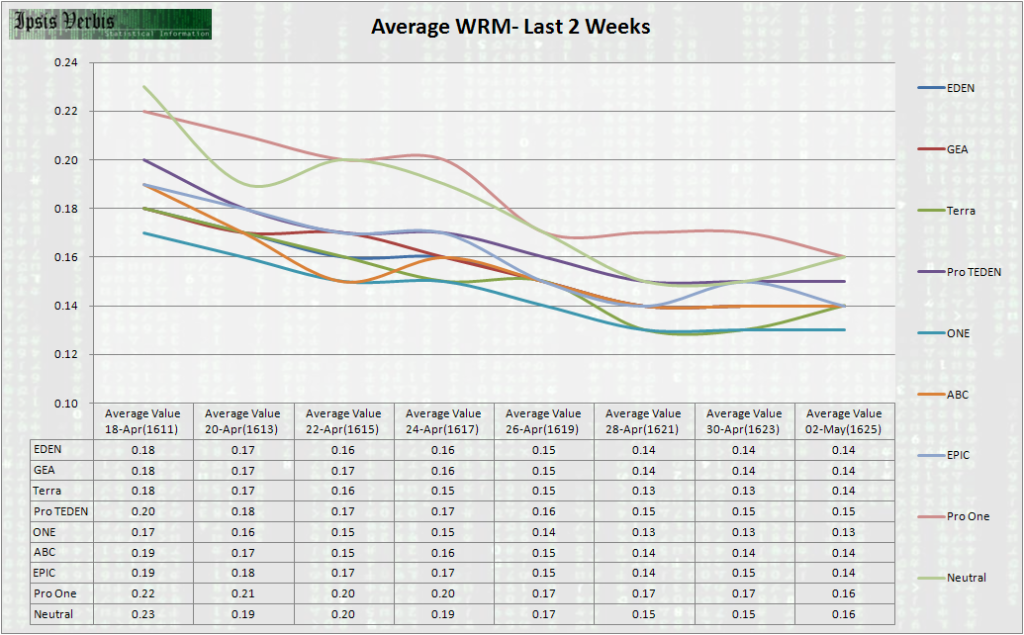
The timeline evolution of prices for each Alliance:
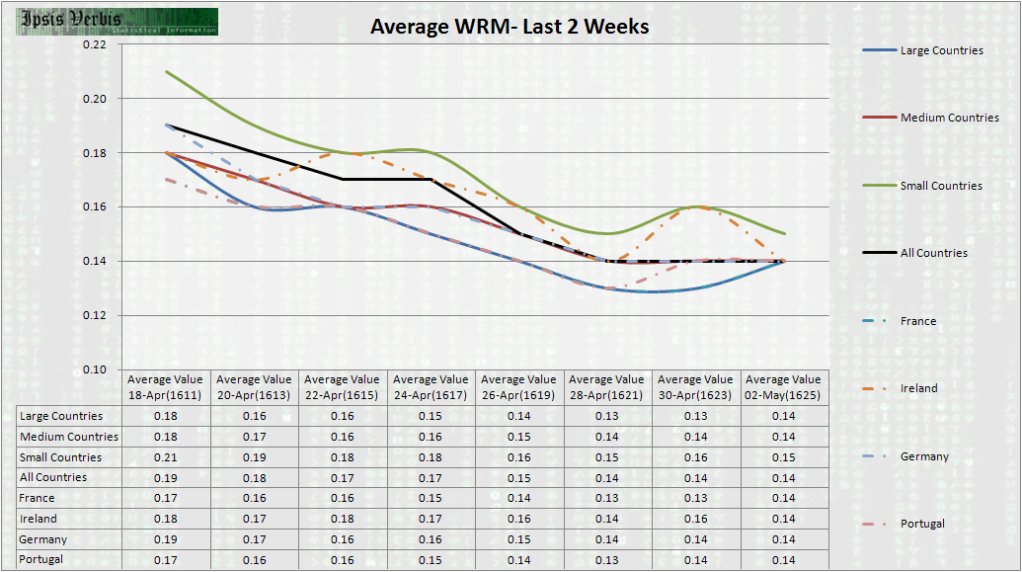
The timeline evolution of prices aggregated by Country Size and the Commonwealth Countries in the backgroun
😛

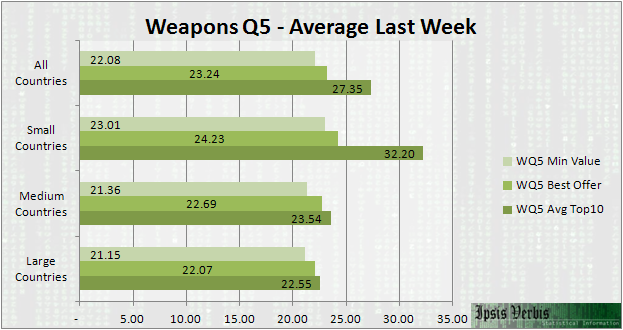
The drop in the value of the Weapons Q5 has been felt in all countries in the past week. The variations are incredible in the smaller countries or if you prefer in the Alliances with the smaller countries like ABC, EPIC or the Neutral Countries.
The following chart is the average value for each alliance concerning Weapons Q5:
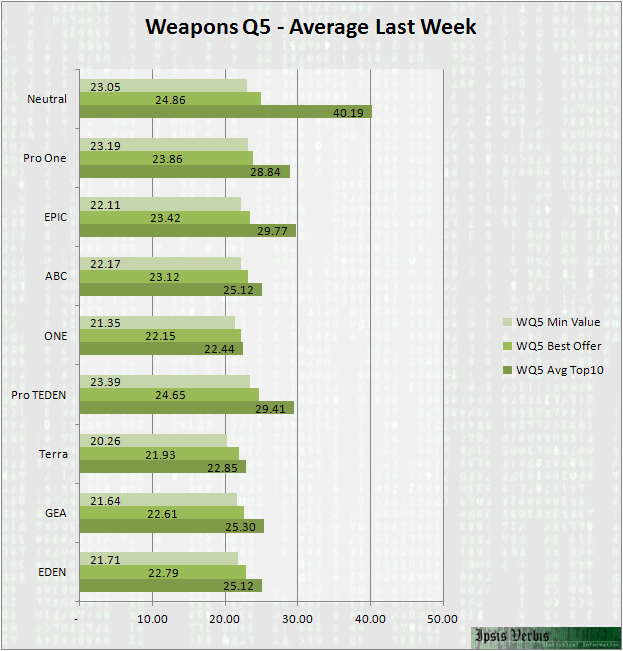
By Big Alliances we have:
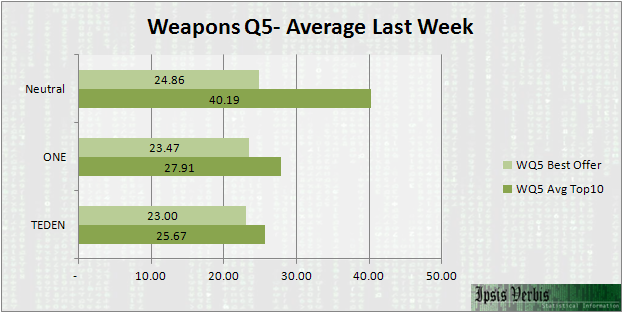
By Size we have:
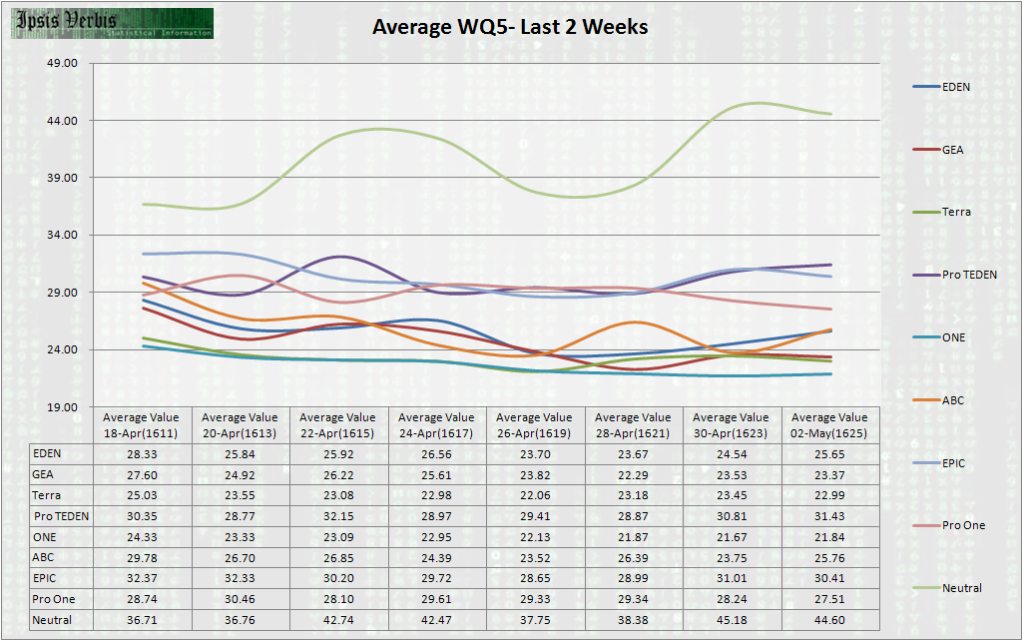
The timeline evolution of prices for each Alliance:
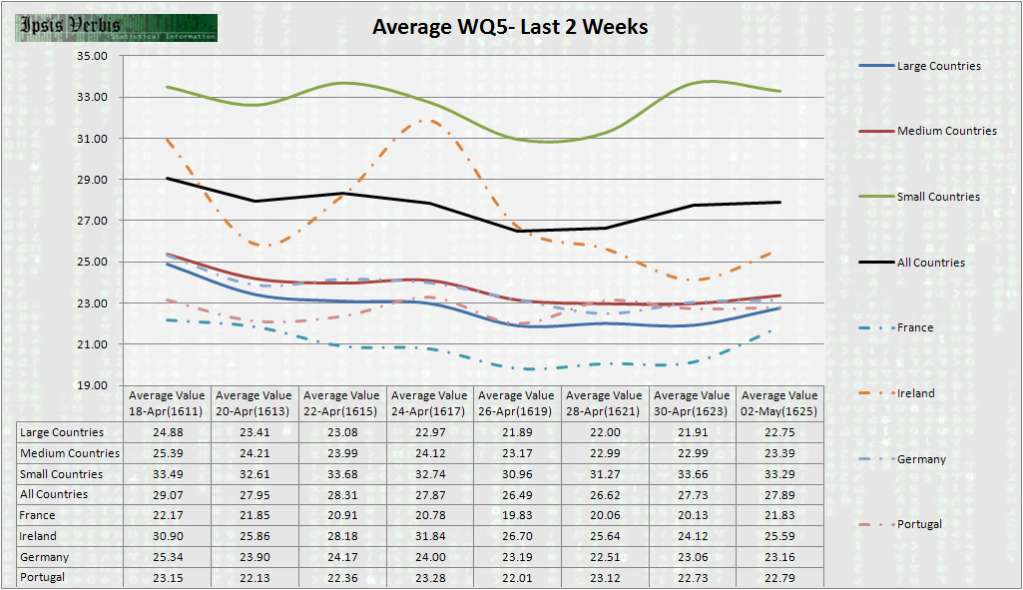
The timeline evolution of prices aggregated by Country Size and the Commonwealth Countries in the backgroun
😛

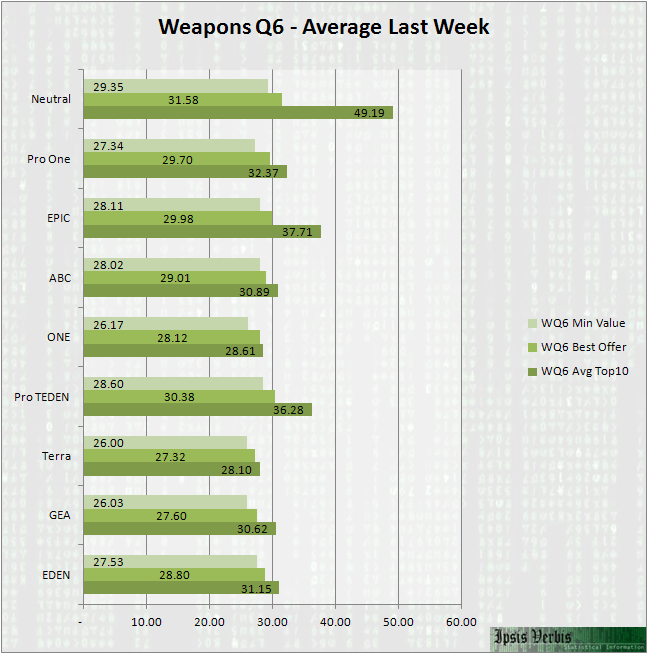
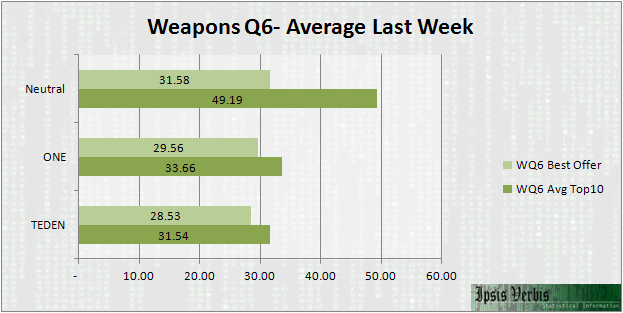
The drop in the value of the Weapons Q6 has been felt in all countries in the past 2 weeks, although in the past week had stabilized slightly.
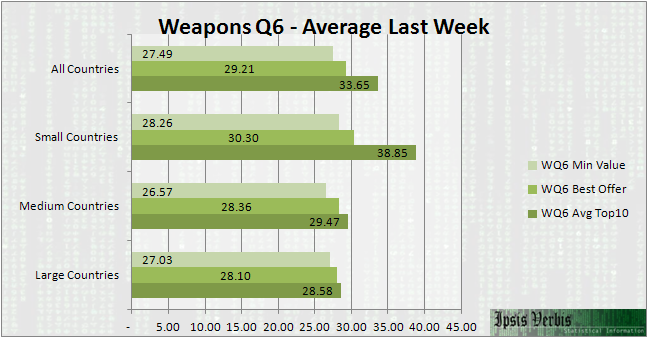
The following chart is the average value for each alliance concerning Weapons Q6:
By Big Alliances we have:
By Size we have:
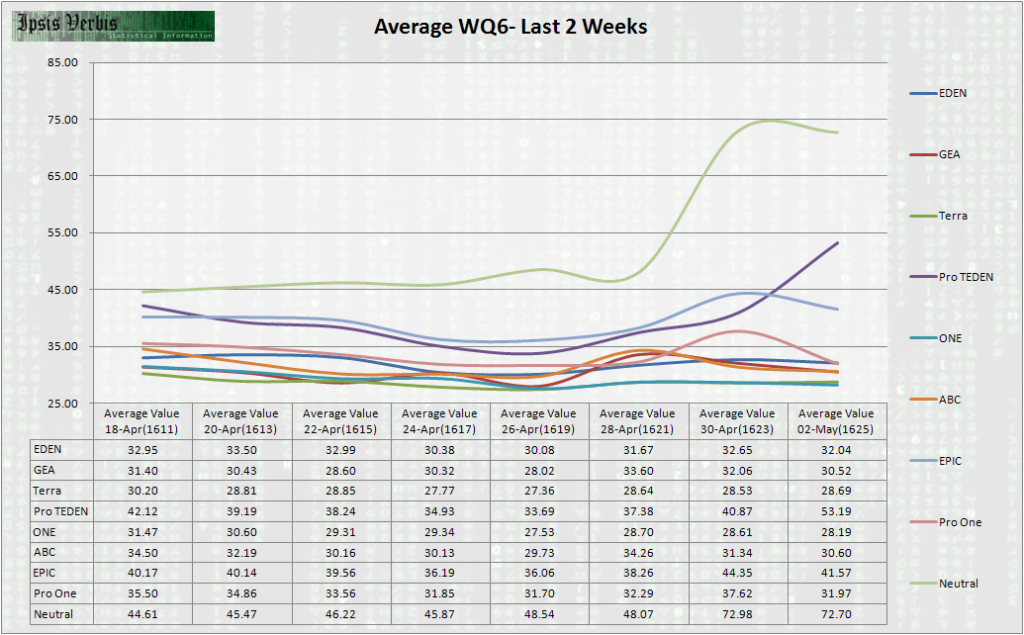
The timeline evolution of prices for each Alliance:
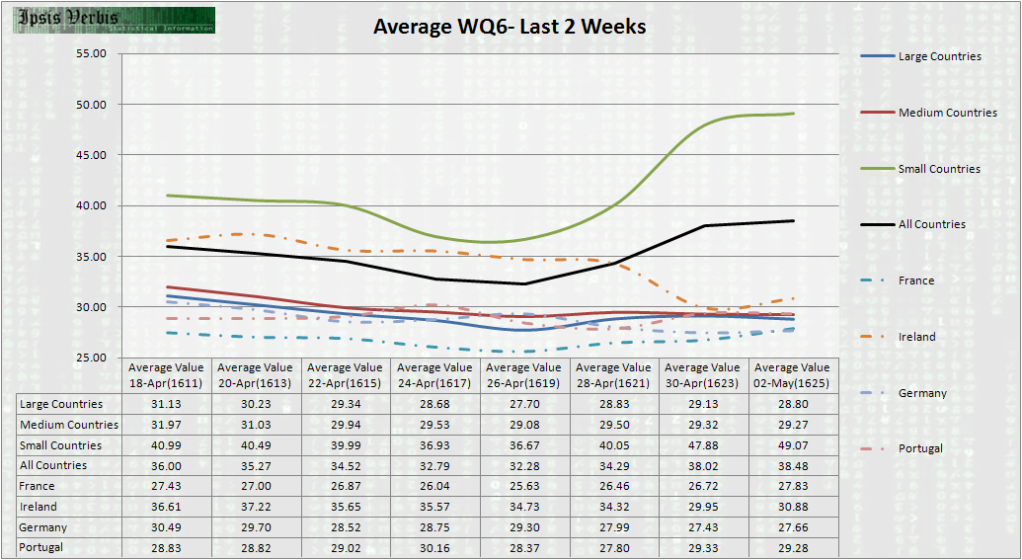
The timeline evolution of prices aggregated by Country Size and the Commonwealth Countries in the backgroun
😛

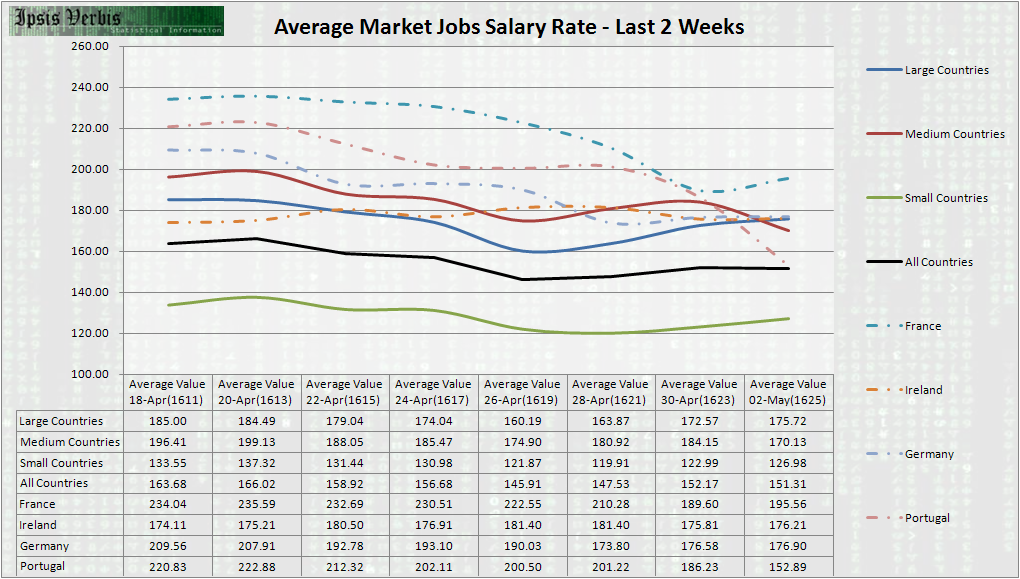
The jobs salary is the only more or less stable variable in the economy module in the past few weeks.
The following chart is the average value for each alliance concerning Jobs Salary:
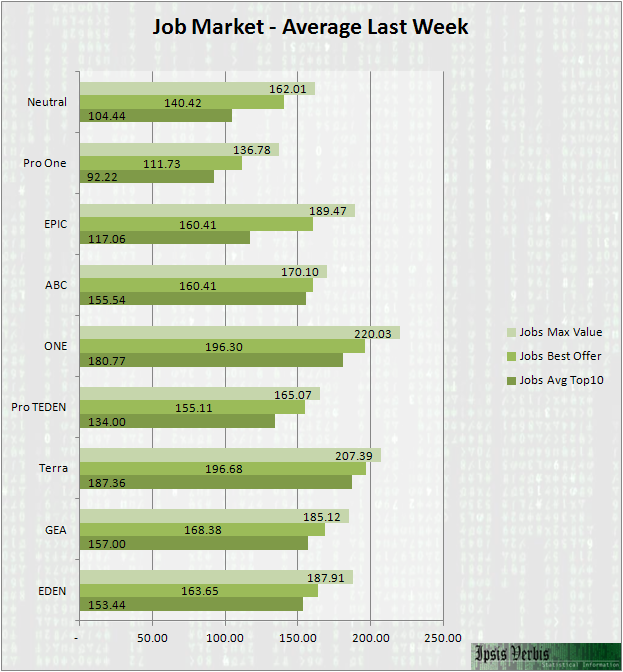
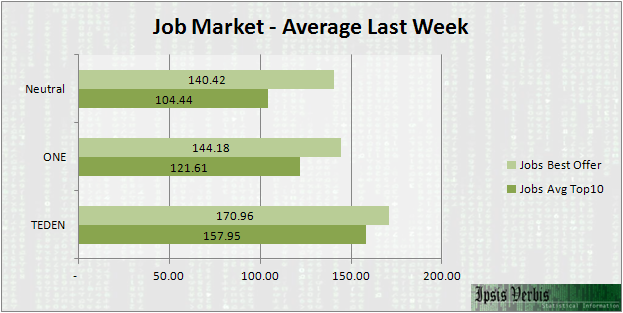
By Big Alliances we have:
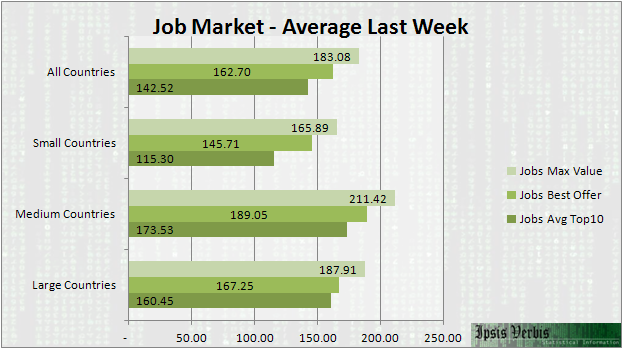
By Size we have:
The timeline evolution of prices for each Alliance:
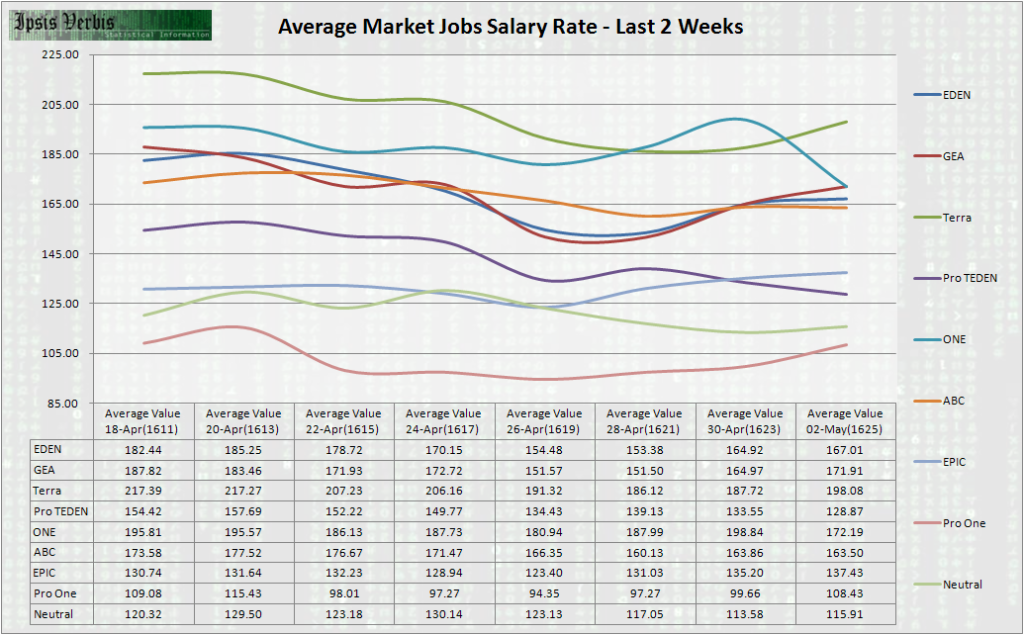
The timeline evolution of prices aggregated by Country Size and the Commonwealth Countries in the backgroun
😛
And that's it for this week analysis.
As always, in order for this information to reach a wider audience, please vote, subscribe and shout this article.
Best Regards,
jotapelx
PS: I'm proud to say that this newspaper has a a Chinese translation in http://www.erepublik.com/en/article/-r-a-17--2025320/1/20


Comments
i will try to give you MM. you deserve it
V
v
Wow nice work buddy
🙂
i cant belive it that u dont have 5 MM-s by now
if anyone deserves it its u
ofc v+s + shout,as always
V+S!
v+s
Votado !
Votado!
voted and subscribed. you deserve it
v+s
very fantastic
FRANCE FIRST \o/