
Strategic Ecomonic Planner
Day 1,766, 05:04
•
Published in South Africa  •
by
•
by
 •
by
•
by Gambit LeBeau

Hey People,
This is an updated article on the calculator for the previous article I wrote. I was given some valuable feedback, and being the person that I am...(OCD), I had to right my wrongs as it were.
Ok, so here goes, firstly it is no longer known as a calculator, it shall now be known as an Strategic Ecomonic Planner, (SEP).
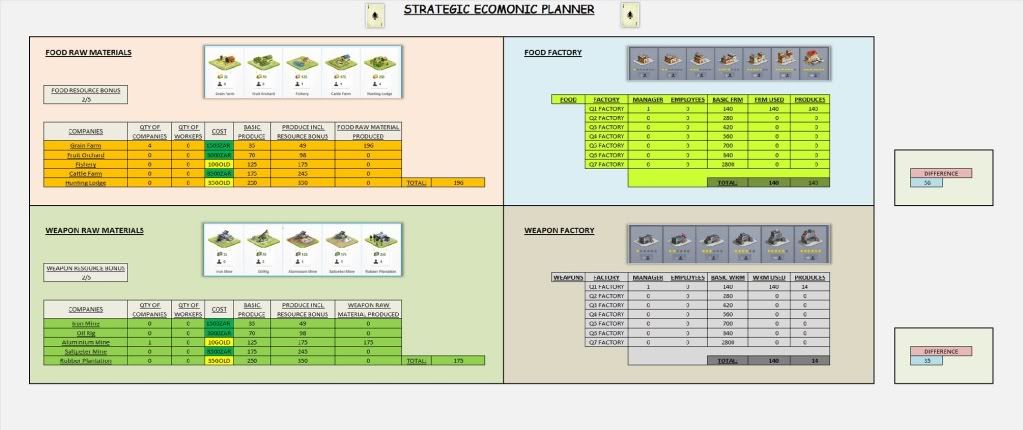
Here is what it looks like. As you can see, it is slightly different from the previous version.
Lets take it one step at a time.
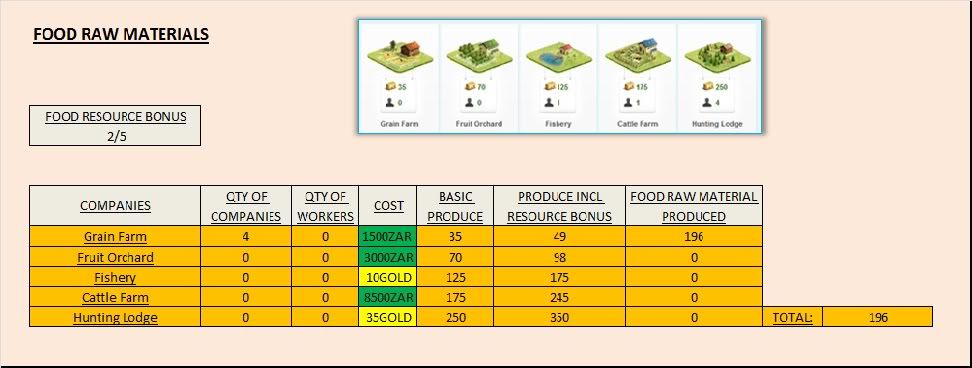
As you see, the companies names are listed on the left, this is important. (so as not to get confused, a pic is also added).
Next is the 'QTY OF COMPANIES' column, this is where you put the total amount of each company that you own. This number should add up to the "work as manager" number that you do every day.
Next is the 'WORKERS' column, same as before, put the total number of workers that you have in the corresponding company row.
The 'COST' column is next - it's just for your info.
The 'BASIC PRODUCE' column is the base line produce of raw materials for each company.
The 'PRODUCE INCL RESOURCE BONUS' column is the ACTUAL amount that each company produces, because of the 'FOOD RESOURCE BONUS'.
The 'FOOD RESOURCE BONUS' fraction can be changed. Make sure it is still a fraction when you change it!!
The 'FOOD RAW MATERIAL' or FRM column, this is where you will see the total amount of FRM produced from each company.
'TOTAL' - this is the total amount of FRM produced each day.
Easy hey..?
The 'WEAPON RAW MATERIAL' table is exactly the same.
Next up, the Factories..
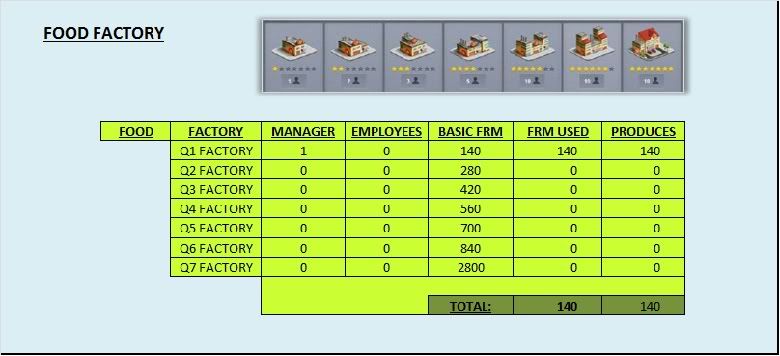
As you can see, picture added again for reference.
In the 'FACTORY' column are all the factories listed in "Q" order.
The 'MANAGER' column, same as with the FRM table, this where you put the amount of each factory you own.
'EMPLOYEES' - this is where the TOTAL amount of workers go for each Q-Factory.
The 'BASIC FRM' - this is the number of FRM used by each Factory to produce food.
'FRM USED' - this is the amount of FRM used by each of YOUR Factories.
The 'PRODUCES' column, this is the total amount of food produced by each Factory you own.
'TOTAL' - Under the 'FRM USED' column is the TOTAL amount of FRM used by all your factories to produce food.
Under the 'PRODUCES' column is the TOTAL amount of FOOD produced by all your factories.
The 'WEAPON FACTORY' table is exactly the same principle as the 'FOOD FACTORY'.
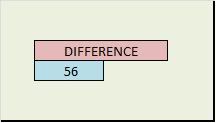
Next is the 'DIFFERENCE' table. To the right of the 'FOOD FACTORY' table is the 'DIFFERENCE' table. This is calculating the difference between the 'TOTAL' amount from the 'FRM' produced and the 'TOTAL' of 'FRM USED'.
If this number is positive, it means you are producing more FRM than what you using - you can sell the leftovers if you want.
If this number is negative, it means you are not producing enough FRM and you need to buy more.
So here it is,
STRATEGIC ECONOMIC PLANNER
If there are any other problems or bugs (I doubt it), but if there are, feel free to pm me, then we can sort it out.
Have fun planning your companies and the best way to achieve your goals.
Play Hard!

Comments
Some good work here, appreciate the effort Gambit
Thanks Gambit!
Awesome work buddy! 😛
I appreciate your compliments. Coming from you guys, that means a lot.
Voted!
Voted, love it.
Very Good!
Great work Gambit. Thanks for your labor. Voted !
Great, thanks
V&S
~hyuu~
I love Gambit, alas there is another one that I fondly refer to in eCan ;P
I like all the effort you put in here mate.
Great work and the effort is appreciated! Almost thought I'd have to break out the old pen and paper. Voted!