
eUK Income Analysis
Day 5,806, 06:41
•
Published in United Kingdom  •
by
•
by
 •
by
•
by Mr Woldy

Citizens!
Content warning - this could get very dry. So make sure you are well hydrated. And if any of it looks too mad for comprehension, do not worry! You don’t need to know this to participate in the eUK. Likewise if you want to query any of it or would like a more detailed explanation of anything here, drop me a message.
What follows is a good old scrape of the Economy Page with some insights and ideas as a chaser. I collect data from the economy pages to look at longer term trends (yes, for fun) which have been used for some of these tables in addition to that which you will find on the economy tab.
Some general housekeeping - There is Money Market Trading and some small concession income which is not discussed here, this predominantly looks at Taxes going into the Country Accounts (CA). Tax income has not been adjusted for the cities subsidy.
We are currently in week 41, it is not yet over so stats provided for it will not be representative (they would be if I wrote this on monday). For reference week 26 was week commencing 26/06/23.
Lets start with our weekly income:
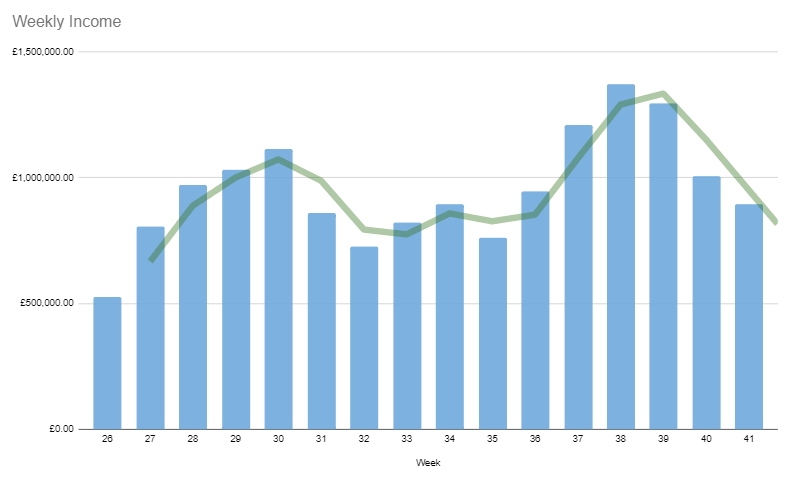
Weekly Total Income - Green line shows 2 week moving average.
So at first glance the figures appear to be optimistic, but it comes with some big caveats! The main being (as I shared with Congress as Governor) that the increase in our total income isn’t anything to do with us!
When we occupy other nations for a Training War, we get a cut of their income. And at the moment it is an increase in the relative income levels of our allies that we are seeing boost our own income. Aw! The most interesting tid-bit about our income is that a big slice of the income boost over the past four weeks has come from North Korea… and even then not from North Korea itself but via it’s Concession agreements with the UEA - big spikes in weapons GDP in UEA is filtering through to NK, which is in turn filtering through to us. What is it they say about a butterfly flapping its wings?
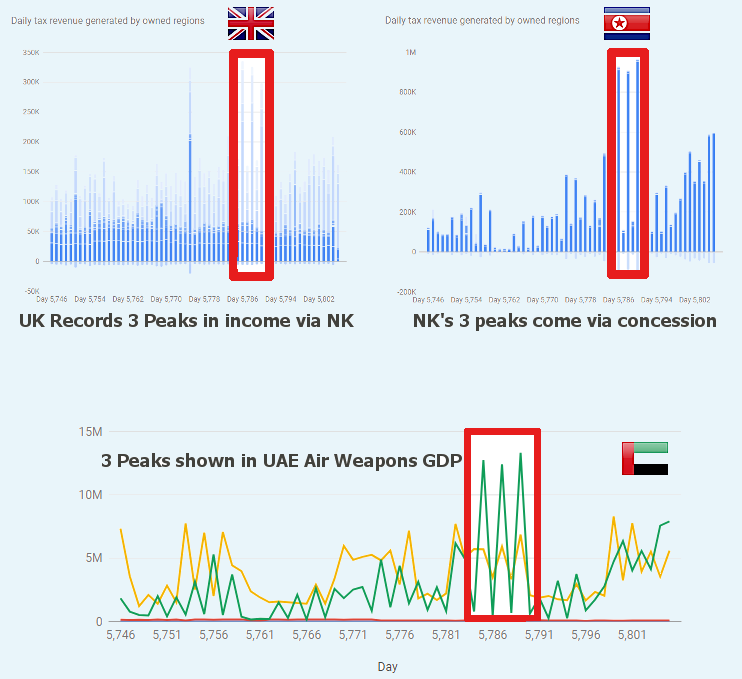
Excerpts from the Economy Page showing where our 3 Peak Challenge came from.
This is a nice illustration of how not everything may be as it seems when it comes to the Economy Page. We return all our TW revenues to our TW partners, and they may in turn return money to others via concession agreements or region agreements.
If we want to see the eUK’s actual income, we therefore have to take a look at our Taxes, plus what we receive back from Training Wars. The below shows the actual sum of eUK Taxes week by week, and a projection of TW income (this is based on the actual value a TW would generate, times the number of returning occupiers - 5. Not all would have been returning over the time period but the calculation is based on what the figures would be if they were).
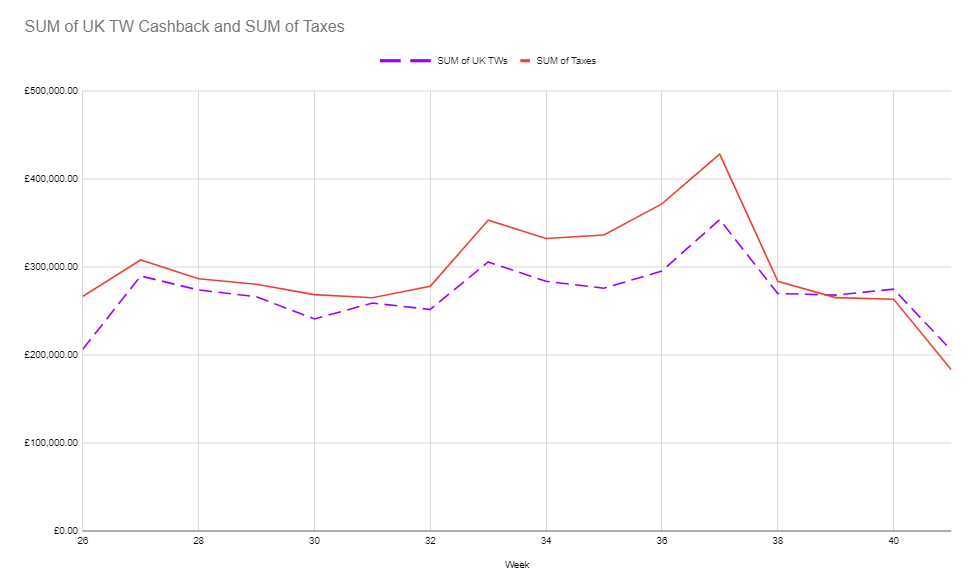
Tax income and TW Cashback if 5 TW’s were active over the period.
It’s important to point out that cities subsidy hasn’t been taken off these figures so not all of this cash will find its way into the country accounts.
Nevertheless, as you would expect there is a correlation between our Tax income and our TW Cashback. That’s a result of how that Cashback value is calculated by eRep.
In terms of weekly income, over the past 14 weeks the weekly income for the eUK has been anywhere between 280k and 420k. The average weekly income is 305k, meaning the eUK can realistically spend around 1.5 Mil a month without losing cash plus whatever is returned via TW Cashback, which could potentially double this sum.
As for a breakdown of that actual Tax income, the below shows it by Tax type:
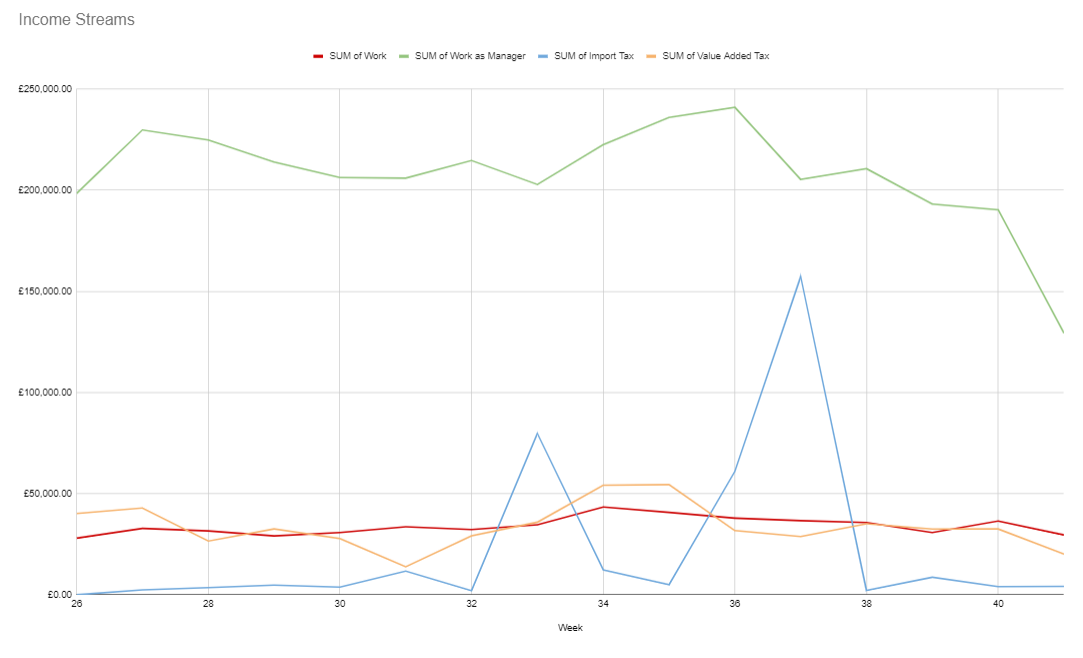
eUK Income by Tax type.
The striking feature of our Tax income is that the fluctuations we see week on week appear to be caused by import taxes, and so it’s probably better to play it safe when spending as import tax is usually very low, but has its peaks which will drive up the weekly sums - unless other tax types those peaks are difficult to anticipate and not guaranteed.
Another interesting feature is our VAT which also fluctuates, but to a much smaller degree. VAT is applied to manufactured good (i.e. not raw materials) which are also tracked on the GDP page. GDP in eRep is quite rudimentary, its a measure of goods sold times the average price, but it does offer a little bit of insight into why our VAT moves around :
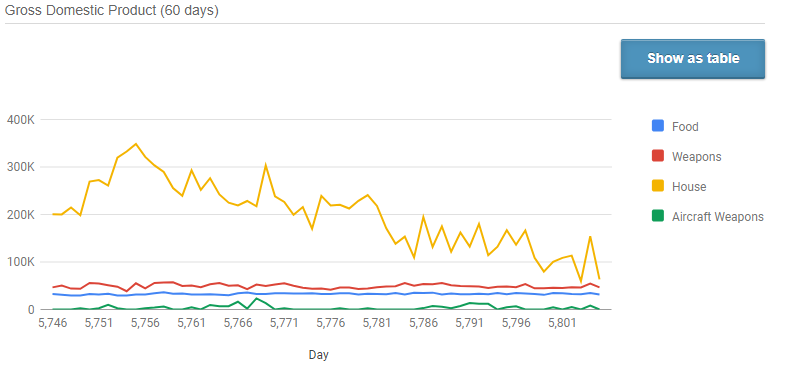
eUK’s GDP.
Fluctuations in VAT appear to be driven by housing sales. Although the housing GDP looks like it is in decline here, it is important to remember that the price is factored into GDP, and Q1 Housing has been getting cheaper over the past few months will be a factor into the downward trajectory of housing GDP.
Taken together however, it suggests that the decline in housing prices is down to a lack of buyer interest - I hesitate to say ‘demand’ because people will want and do buy houses, but my interpretation would be that the consumers have more houses they can use and so that baseline level of demand may be difficult to stimulate via conventional means such as giveaways. In fact the drop in Housing GDP on day 5,795 following a round of grants being paid further suggests the figures reflect not potential buyers without the means to purchase but in fact over saturation of the market.

So the big question - so what? Earlier in the Congressional term a payment schedule was approved based on estimates of how many donates there would likely be and where that money could go. Albeit our income is relatively stable large debts incurred to NK shown at the top of this article may mean some tweaks would be useful to the everyday Business of Government. I would suggest two of the four donates that had been planned for the eUK Defence Fund go instead direct to the BoE to ensure there is enough cash to hand to pay back the ‘three peaks’ with a buffer in case there’s a fourth! (It seems likely there may be cash leftover for the eUK Defence Fund at the end of the month even with this alteration).
As for the Housing market, there’s all sorts of things we could try. There is a bigger question as to whether cheaper housing is a net benefit, though we do operate in a rebate-rich nation. If however people had an interest in seeing if we could raise GDP or create a small upward pressure on housing prices, some suggestions could be; offer export licence rebates; offer loans to upgrade Q1 housing companies; fund the buying up of surplus or incentivise sellers to withdraw offers until black friday events begin. I don’t intend to recommend them but it would definitely be interesting to see if a reduction in surplus would halt the decline in house prices and so impact GDP… what’s eRep if not an experiment after all!
Thanks for reading,
Mr Woldy


P.S. This article doubles up as a powerful sedative for those suffering from loss of sleep.
Comments
i was here
Really good to see some in depth analysis,
Its like a earthquake but in my head...
I'm going to increase your insurance premiums at this rate
Amazing analysis. Thank you for sharing the results!
Good analysis, thanks for sharing \o/
The decline of the UK's House GDP is likely linked to the increase in salaries on offer and a the stability / perhaps slight decline of the prices of houses as a result of worldwide supply nearly always enough to meet demand if not always exceeding it. That might change in April 2024? if we have a repeat of the event which rewards citizens for the number of houses they have active however that only drives a short price spike in houses.
With a maximum 125% bonus the UK presents a challenging location in these market conditions. I'd estimate that during the 60 day record at peak we had around 35 houses manufactured in a 60 day period in the UK (assuming it's mostly Q1 and Q2 however maybe a scattering of Q3 to Q5, who is to know!) and currently it looks likely we have less than 10 houses manufactured in the last 60 days in the UK which indicates our local producers are struggling.
Even those with a 190%+ or even 200%+ productivity bonus in regions outside of the UK in countries with good housing bonuses should be making sure they understand the difference between their average salary versus their sell price to ensure profitability due to competitive market conditions.
Food is the best area to try and increase GDP, if we could secure a Deer resource concession, it would bring the UK to a full food bonus and a very appealing place to manufacture food. Food production could also increase work as manager revenue (although admittedly any food producer should be buying their FRM not WAM due to the current price of FRM and the Tax cost associated with WAM production of FRM). Securing a Deer resource has been something I’ve had in mind for the UK for a number of years, however difficult to achieve due to the scarcity of the resource and its appeal to many countries.
Good to see things like this discussed in a national forum though.
Sorry for clarity a peak of around 35 houses manufactured daily in a 60 day period and more recently in the 60 day period we seem to be have days of 10 or so houses being manufactured sometimes a lot less
We need to bring the work back to the eUK.
Is that kind of the message here? I'm am not smart 😃