
The Economist ~ Work Tax revisited
Day 3,811, 09:35
•
Published in United Kingdom  •
by
•
by
 •
by
•
by Spite313
Please vote and subscribe

Dear friends,
Today we’re going to take a second look at work tax, and more specifically what it can tell us about the world economy. Following my “world without WAM” article, I had a lot of messages saying that WAM (Working as Manager) was now the primary source of tax income for most countries, and that the economy wouldn’t survive a switch. That is true and it isn’t, because workers do get taxed, and without WAM everything would have to be done by workers. Wages would therefore rise, as would prices, and ultimately everything would more or less balance back out again.
However it did make a good point. Today Work Taxes provide a huge amount of income for all countries. Every time a citizen clicks work, they are taxed. If they worked in their own country, the government gets 100%. If they worked abroad in a foreign-based holding company, the government gets 20% (and the foreign government 80
Work tax: the costs
In any case, I decided to look at it again. Firstly, let’s narrow it down to the thirty biggest economies in terms of their WAM output. Let’s look how much it costs to work in each country each time you click work. Remember, this is based on the work tax as a percentage of the median wage for that country, as calculated by the admins.
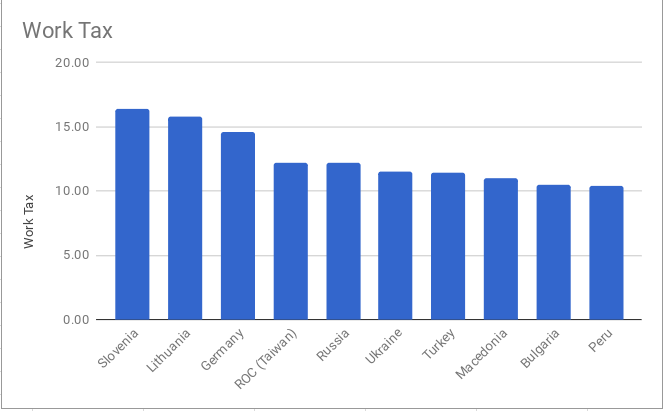
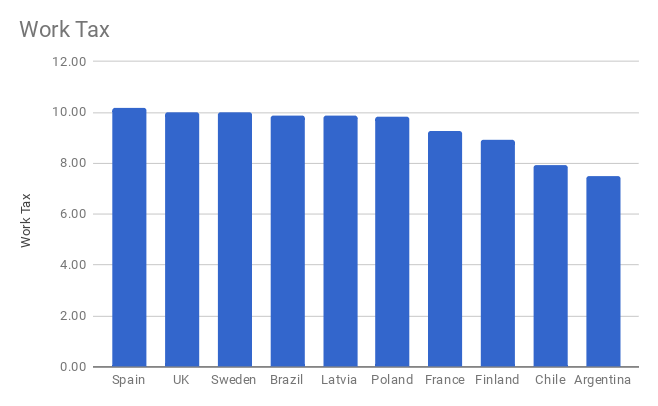
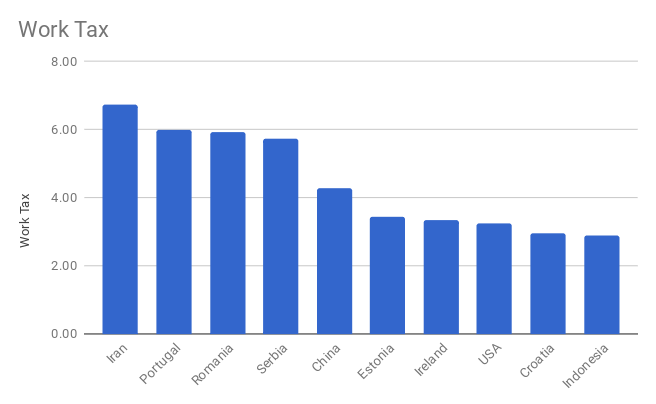
As you can see there is a fair bit of difference between the cheapest and most expensive countries to work. Even comparing say, Romania and Poland, the tax is around 4cc different, which is not a small amount of money considering the profits on Q4 WRM can be as low as 9-11cc under normal circumstances.
Median wages
Apart from the work tax rate itself, the amount you are taxed is based on the median wage over the past 30 days. So let’s look at that next.
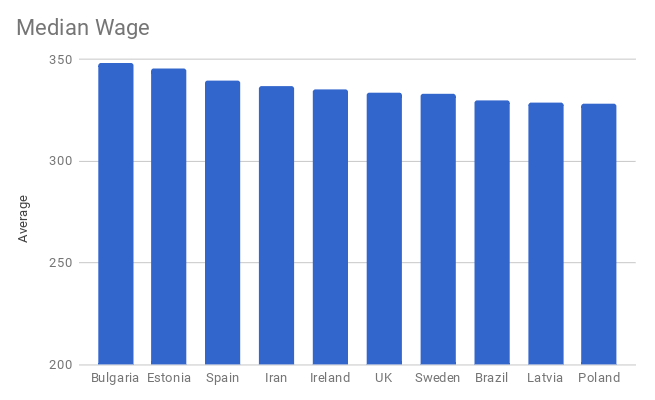
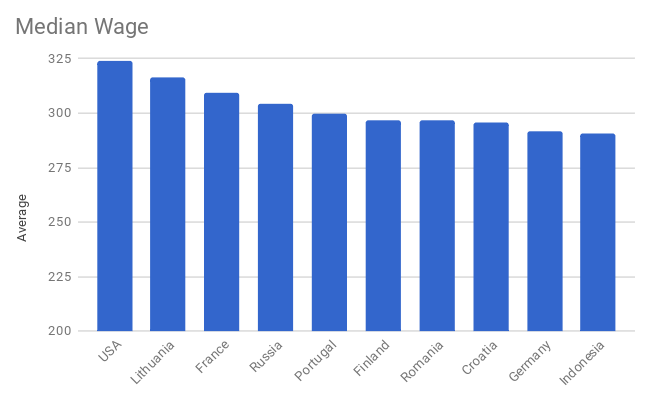
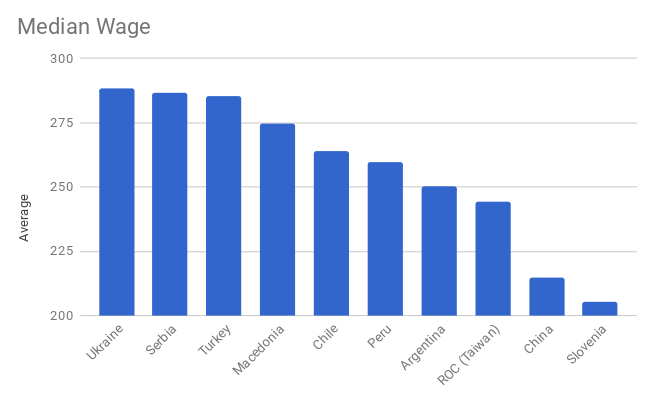
Most active countries have higher median wages due to a busier job market. There are some exceptions- Slovenia has a very low median wage, presumably due to commune usage in the country. That counterbalances somewhat the very high (8
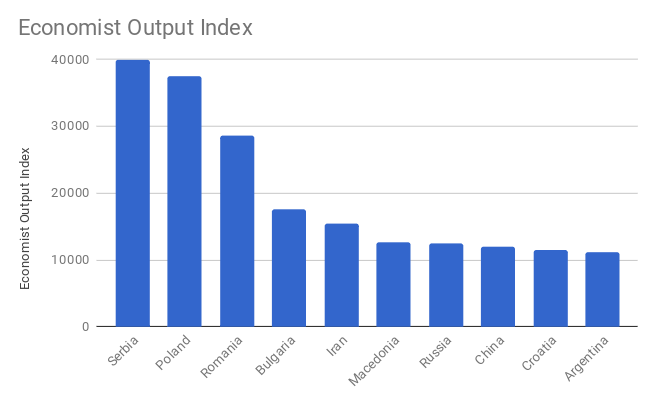
Economic output
National income has a number of sources. Work tax from citizens is one of them, as is income from occupied territories (which includes more than just work tax), donations, CO taxes, working taxes (which is slightly different), VAT and gold medal taxes. There are also various drains on income. Calculating all of this is impossible with the tools the admin has given us, so I haven’t tried.
As a simple measure of the core productivity of each country, I’ve calculated the work tax income, divided this by the “cost to work” numbers above, to give a rough idea of the WAM output of each country. As stated above, this is not accurate and doesn’t pretend to be. Factors which throw this out are:
1. Citizens working abroad and only contributing 20%
2. Foreigners working at home and only contributing 80%
3. Income from occupied regions (which is calculated strangely)
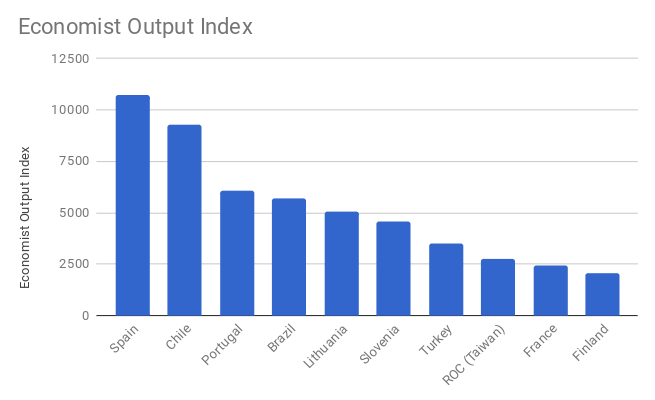
With a few exceptions though, this does not have an enormous effect on most countries. The exceptions being those countries currently wiped/mostly wiped, and those countries where due to recent and likely unsustainable conquests, large portions of their income originate abroad. In any case, these figures are indicative if not definitive, and to avoid frustration and argument I will call this the Economist Output Index and like all great indexes, fudge the figures a bit.
 [img][/img]
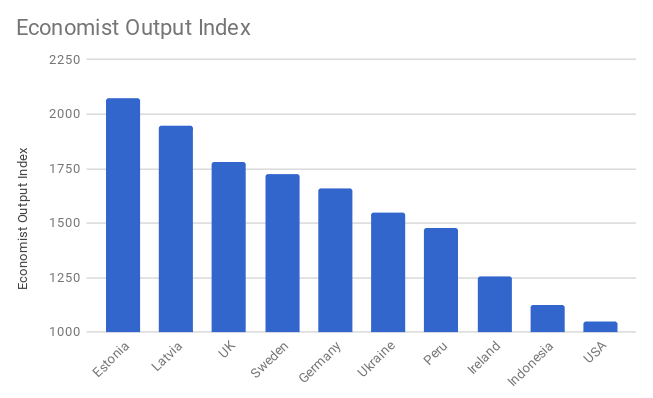
The remaining 40+ countries add up to a total economic output (on the index) of 11266.
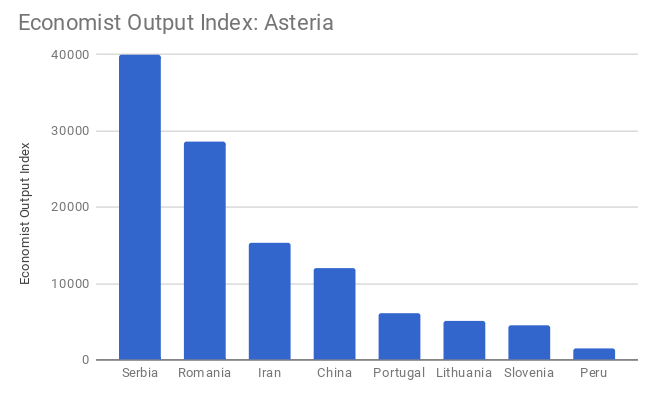
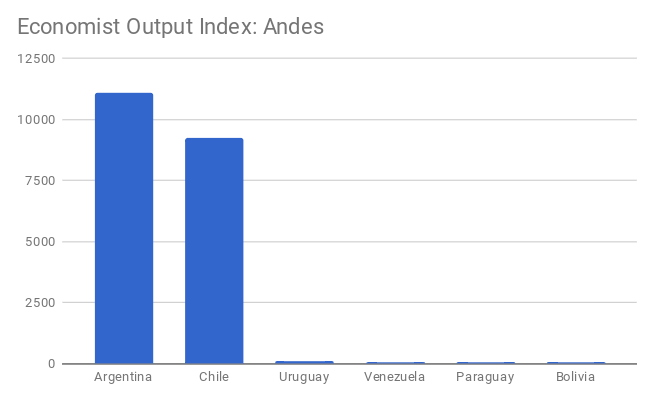
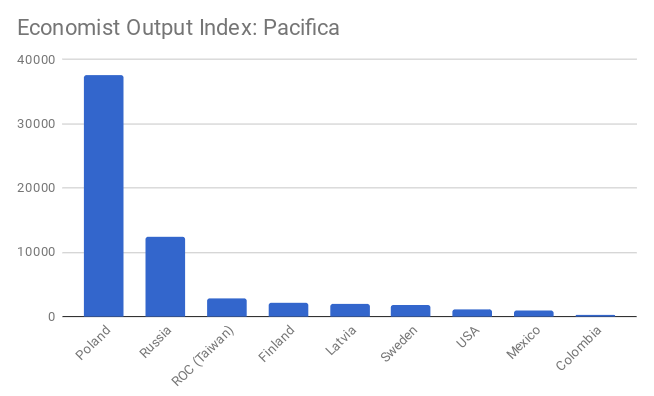
Alliances
Next we can look at the three current alliances of any significance. Pacifica is currently much weakened due to the occupation of the US, but it is interesting that it is more of a rival for Asteria than Andes is.
And a straight comparison of the three:
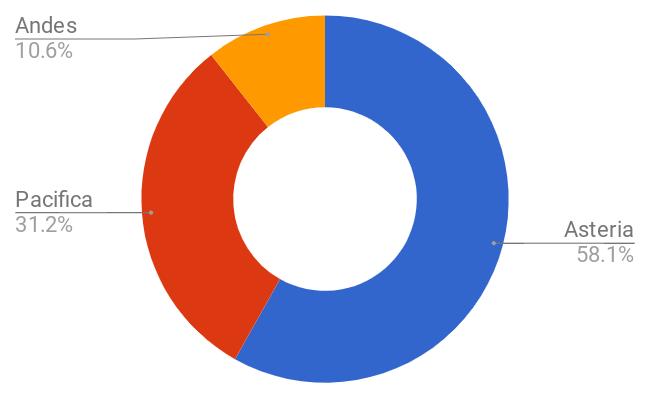
And finally for a bit of fun, Asteria and (broadly) pro-Asteria vs the world. Obviously what counts as pro-Asteria is very much subjective, and Asteria itself does not recognise any such group (only its ‘friends’, which generally is indicated by an Asterian MPP stack).
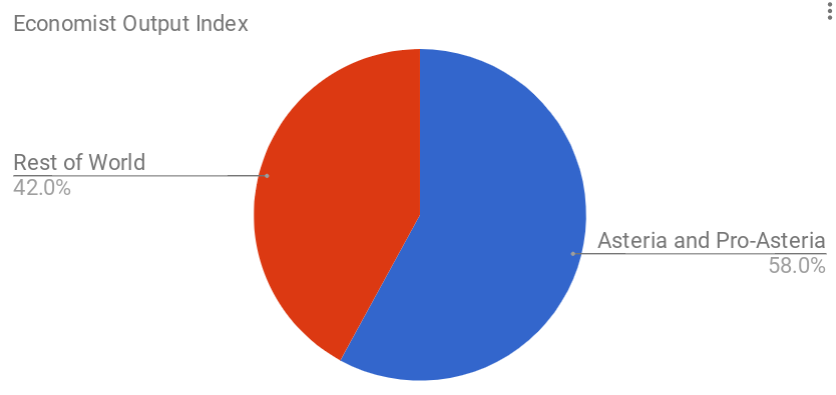
As you can see, five of the six most productive countries are Asteria or pro-Asteria. In addition, because of their military dominance, Asteria and Pro-Asteria nations are also more likely to have additional income from occupations. Military power aside, this puts them in an incredibly strong position.
Conclusions
This is not meant to be, as I said, an accurate way of assessing country economic output. But despite the known inaccuracies, it serves to show in broad strokes which countries produce the most, and how that affects the global political scene. Cicero famously said that the sinews of war are infinite money, and it is true that war is incredibly costly. Therefore whichever alliance can command the most wealth will, for the most part, win the war. Gold buyers can skew the odds somewhat, but taxation is still the main source of income for most countries.
I hope you’ve found the article interesting, and I welcome your comments below.
Iain

Thank you’s
Many, many people endorsed my last article. A lot of them were Croatians, who understandably enjoyed an article about their country. However there were also endorsers from other countries, many of which do not see eye to eye with Croatia. I want to thank those people most of all. In ancient Greece they had a concept called arete, which broadly translated means nobility or goodness. It is the idea that you should always be the better person, try to be objective and congratulate your opponent when he defeats you. Those enemies of Croatia who could congratulate them on their victory displayed arete and I salute you.
Dear friends,
Today we’re going to take a second look at work tax, and more specifically what it can tell us about the world economy. Following my “world without WAM” article, I had a lot of messages saying that WAM (Working as Manager) was now the primary source of tax income for most countries, and that the economy wouldn’t survive a switch. That is true and it isn’t, because workers do get taxed, and without WAM everything would have to be done by workers. Wages would therefore rise, as would prices, and ultimately everything would more or less balance back out again.
However it did make a good point. Today Work Taxes provide a huge amount of income for all countries. Every time a citizen clicks work, they are taxed. If they worked in their own country, the government gets 100%. If they worked abroad in a foreign-based holding company, the government gets 20% (and the foreign government 80
😵. If they worked in their country, but it’s occupied… well it gets tricky. The way occupied country “income” is calculated takes into account more than just WAM it seems.
Work tax: the costs
In any case, I decided to look at it again. Firstly, let’s narrow it down to the thirty biggest economies in terms of their WAM output. Let’s look how much it costs to work in each country each time you click work. Remember, this is based on the work tax as a percentage of the median wage for that country, as calculated by the admins.
As you can see there is a fair bit of difference between the cheapest and most expensive countries to work. Even comparing say, Romania and Poland, the tax is around 4cc different, which is not a small amount of money considering the profits on Q4 WRM can be as low as 9-11cc under normal circumstances.
Median wages
Apart from the work tax rate itself, the amount you are taxed is based on the median wage over the past 30 days. So let’s look at that next.
Most active countries have higher median wages due to a busier job market. There are some exceptions- Slovenia has a very low median wage, presumably due to commune usage in the country. That counterbalances somewhat the very high (8
😵tax rate. An 8% tax rate in Slovenia is equivalent to a 5% tax rate in Bulgaria due to the big difference in median wage rates. As a general rule, countries with low (below 300) median wages should have higher tax rates to compensate.
Economic output
National income has a number of sources. Work tax from citizens is one of them, as is income from occupied territories (which includes more than just work tax), donations, CO taxes, working taxes (which is slightly different), VAT and gold medal taxes. There are also various drains on income. Calculating all of this is impossible with the tools the admin has given us, so I haven’t tried.
As a simple measure of the core productivity of each country, I’ve calculated the work tax income, divided this by the “cost to work” numbers above, to give a rough idea of the WAM output of each country. As stated above, this is not accurate and doesn’t pretend to be. Factors which throw this out are:
1. Citizens working abroad and only contributing 20%
2. Foreigners working at home and only contributing 80%
3. Income from occupied regions (which is calculated strangely)
With a few exceptions though, this does not have an enormous effect on most countries. The exceptions being those countries currently wiped/mostly wiped, and those countries where due to recent and likely unsustainable conquests, large portions of their income originate abroad. In any case, these figures are indicative if not definitive, and to avoid frustration and argument I will call this the Economist Output Index and like all great indexes, fudge the figures a bit.
[img][/img]The remaining 40+ countries add up to a total economic output (on the index) of 11266.
Alliances
Next we can look at the three current alliances of any significance. Pacifica is currently much weakened due to the occupation of the US, but it is interesting that it is more of a rival for Asteria than Andes is.
And a straight comparison of the three:
And finally for a bit of fun, Asteria and (broadly) pro-Asteria vs the world. Obviously what counts as pro-Asteria is very much subjective, and Asteria itself does not recognise any such group (only its ‘friends’, which generally is indicated by an Asterian MPP stack).
As you can see, five of the six most productive countries are Asteria or pro-Asteria. In addition, because of their military dominance, Asteria and Pro-Asteria nations are also more likely to have additional income from occupations. Military power aside, this puts them in an incredibly strong position.
Conclusions
This is not meant to be, as I said, an accurate way of assessing country economic output. But despite the known inaccuracies, it serves to show in broad strokes which countries produce the most, and how that affects the global political scene. Cicero famously said that the sinews of war are infinite money, and it is true that war is incredibly costly. Therefore whichever alliance can command the most wealth will, for the most part, win the war. Gold buyers can skew the odds somewhat, but taxation is still the main source of income for most countries.
I hope you’ve found the article interesting, and I welcome your comments below.
Iain
Thank you’s
Many, many people endorsed my last article. A lot of them were Croatians, who understandably enjoyed an article about their country. However there were also endorsers from other countries, many of which do not see eye to eye with Croatia. I want to thank those people most of all. In ancient Greece they had a concept called arete, which broadly translated means nobility or goodness. It is the idea that you should always be the better person, try to be objective and congratulate your opponent when he defeats you. Those enemies of Croatia who could congratulate them on their victory displayed arete and I salute you.
Comments
Well I don't know very well about economic calculation,
but I subbed you as 5839th subber
Good job for astounding review
I appreciate it.
Thank you, I always appreciate a sub!
Bravo
why am i not getting any images here?
Not sure, they work for me. Its just imgur.
Because he is using imgur to upload images and that doesn't show up to everyone for some reason.
Uhhhh I wish I'd know that. I will move. Them all to somewhere else.
Does it depend on your ISP? Because I though I was ok until I changed ISP on Tuesday
I've re-uploaded with another image host, hopefully that's resolved it.
No idea tbh, it started to be a problem long time ago, I've remembered an old article where a guy sent a ticket to Imgur, asking why don't his images appear in eRepublik, he got this answer:
"Unfortunately that site has been blocked from hotlinking due to multiple instances of abuse of Imgur's terms of service. The terms of service can be found at http://imgur.com/tos. We don't allow hotlinked images being used as content for other websites. We suggest using another site that does allow being used as a content delivery network. I apologize for the confusion. Please let me know if I can help further.
"
On the other hand, I always see Imgur images, but loads of people don't...
Quite a few UK ISPs did block imgur. Never had a problem with it myself.
Arete is mastership opposed to teckne (craftmanship)
Arete means excellence or moral virtue in any field. Tekne isn't the same type of term, it just means (as you say) craftsmanship.
Arete may be related to aristo ( the better) or welsh arian(money)
I guess erepublik is largely counterbalanced by the gold bot ,and some other bots that buy WRM to inject money into the system
Either an artificial workforce (slavery) , or an artificial demand (bots) can sustain a capitalist economy.
I'm absolutely in love with your writing.
economy in erepublik, does it exist????
Wait, the UK has a top 30 economy?
23rd, to my surprise
o7
Great article. Tried to make an alike assessment myself sometime before, it showed Ru as 5-8th economy on aggregate. Good to see people with expertise and talent make same assessment 🙂
I was a little surprised by both Russia and Iran, but when I think about it both countries are solid choices for places to base companies.
You should write an article about this,... Currently mine are based in eUK, so I haven't been affected by the wipe. But I guess countries that are both stable and with many bonuses are the best.
impressive !
Work Tax can influence medals,and few country have a few powerful soldiers, they through diplomacy make Training Wars. Take 100 millions damage from high-legend bonuses.
Ex: Albania, South Korea, United Arab Emirates and few mini country.
Finally, Work Tax also influence Combat Orders, if World have a great CO war, soldiers actively participate in the war, will affect taxes.
So Ireland's got a healthy economy for its size 🙂
Not too shabby!
Beautifull. Interesting to see which countries in Andes have actual economic might...