
Non-Rigged Elections, Or how I learned to stop worrying and love Kemal
 •
by
•
by Aren Perry
A recent article was published showing simulations of an election under the independent voting assumption and that it is frequently the case that without rigging the end outcome is decided by the first third of the votes. Many people called this "good math" but "bad results" because voting isn't i.i.d. Some called this an abuse of the Law of Large Numbers (which while I will not address here-it was a perfect use of it. Those who thought otherwise were confusing Kemal's plotting of the sample proportion verses individual results...I hope.)
This all missed the main point: The behavior of the first third predicting the end outcome is NOT evidence of rigging because such behavior is possible and plausible when we do not have any rigging whatsoever.
So, in support of my brother in Statistics (though technically in Economics), I thought I would show two things below:
One: The vote total being predicted by the first third is not what we would generally expect from voting rigging from say, MU's or any group of individuals (bot or not) voting in blocks together or systematically in clusters.
Two: While Kemal's simulations did not include dependence, and that was not the point (see main point above), let's add some dependence and see what happens anyways.
I have included tldr tidbits you can look for if you are not interested in the details.
Assumptions I assumed in all cases that "true" end vote percentage for one candidate is 55%. The vertical line is where the first third of them have voted. The horizontal line is the "true" end vote percentage on average (55😵
. The different color lines are multiple different simulations so we can see what happens more than once.
One:
First, as a baseline, here is the same thing Kemal di😛
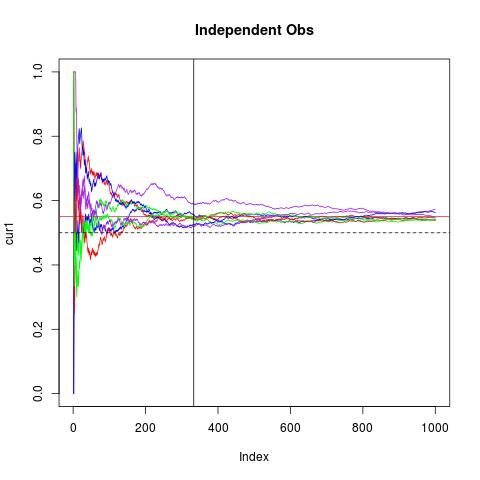
Things are very "tight" as expected for this ideal situation. However, it shows that it is not unexpected that the first third would predict the end outcome even with a close margin of 5% difference. Compare this to the random walk model we expect a fixed election to (possibly) follow:
The simplest model (but effective!) we can simulate from that has clusters of voting of similar types together is one where we make the probability of the NEXT vote being for one candidate being linked to the probability that the PREVIOUS vote is for that candidate.
That is, if the previous vote was for DMJ with say, probability 80%, then the probability that the next vote is for DMJ should be around 80% as well. It is called the "locally clustered" model as referenced by my major professor. These clusters can represent either gradual systematic bot programming or "hit at once" scenarios just by changing the variability associated with the movements. Either way, the behavior is still the same.
This is called a Random Walk model on the mean of the binomial process. See the graph here:
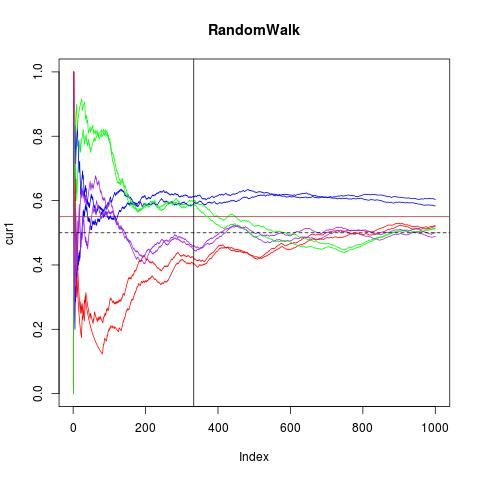
The tl/dr for the above is the second graph is representative of a possible rigging mechanism either by bots or by mass voting.
As you can see there is much more variability in the movement of the overall voting proportion. Also, at the 1/3rd mark, two of the 8 simulations (both green ones by total coincidence) are NOT with the end winner. This means there is a 25% chance that the end result is not correctly predicted at the 1/3rd mark. Thus, it seems that the ending NOT being predictable is better evidence for rigging!
The tl/dr for the above is the second graph is representative of a possible rigging mechanism either by bots or by mass voting. The first represents Kemal's simulations. The first graph says that independent votes are a VERY plausible scenario for why we can predict the outcome off of the first third, the second says that rigging the election means that prediction based off of the first third is plausible, but LESS plausible than under totally random voting! Current voting behavior we have observed suggests we have a random voting procedure (most likely)!
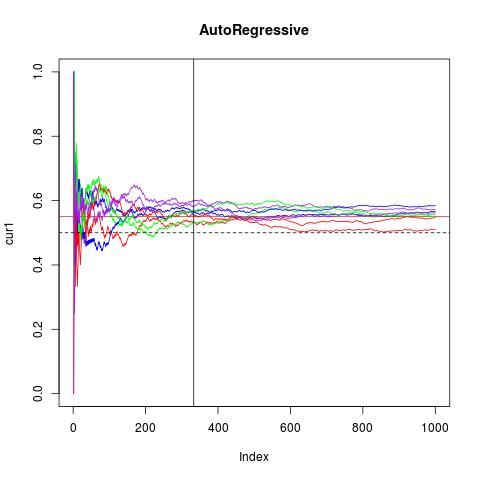
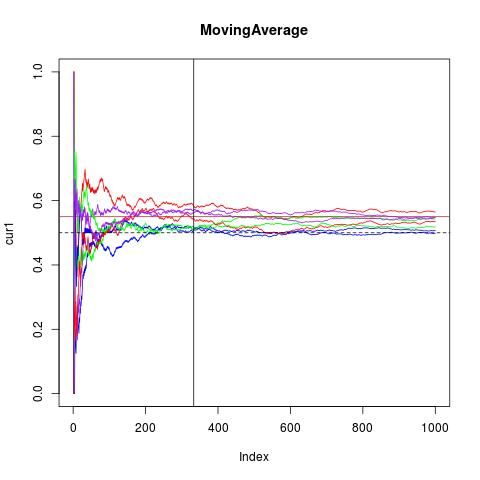
Two: Some criticized Kemal not so much because he didn't simulate a "rigged" case, but because the independence assumption isn't realistic to the situation because voting is a process that has some dependence. Thus, here are two types of models that have dependence but are not indicative of behavior you would expect of rigging.
They are the AR and MA time series models applied to the mean of the binomial process. If you want more detail I will gladly give them (I will say I chose dependence parameters of 80
😵, but here they are:
tl/dr
The above show dependence but not rigging. Compare these to the two prior graphs. Like I commented in Kemal's article, they show less certainty (less effective sample size) in the first third of the end results but with much more consistency than the "rigged" model.
In conclusion: Dependence of voting results in the same general behavior as observed by Kemal validating his conclusion and simulations that showed that being able to predict the winner with the first third is very, very plausible without rigging.
Also, rigged elections are more likely to be hard to predict with the first third than non-rigged. Thus, the consistency within the first third is evidence FOR non-rigged elections more than rigged. Just for the sticklers I will note that one could build more complicated models to more accurately mimic an infinite number of possible rigged scenarios more closely (literally infinite). My example is just one of those possibilities and is the most generally plausible and general scenario statistically speaking (random walk).
tl/dr[\b] Kemal was right-dependence or not his methods AND conclusions were appropriate.
Aren Perry
Frustrated Stat Guy
Comments
OK, first, you need to edit your article to use the actual image links (like http://i.imgur.com/J8sq8ly.jpg) so your [img]tags will work. Second, good analysis, voted and subbed.[/img]
Yeah thx I fixeded it 😛
Your graphs include many more lines than Kemal's. What do the different lines mean?
The different lines are multiple simulations of the same process. Kemal did this but he jsut didn't plot multiple. By plotting multiple you can see how the process can differ from itself, and how it has certain constant characteristics.
FIST
whatever happened to the ata boy jokes???
Who is John Galt?
A lot of ass-umptions here!
Apparently you don't have a good understanding of statistical models. That's true for most people and that's fine. But trust someone who is a phd candidate at a top ten university 🙂.
Well statistics only help you understand when something happened why it happened. It's a useless tool to predict anything happening.
And bragging about phd & top 10 university won't earn you any points in my universe - quite the opposite!
Statistics is far from a useless tool to predict anything! I'm currently using it to help predict power output from green energy sources.
Oh and, funnily enough, the thing you claim statistics can do is where it struggles 😛. It can do it, but it's much easier to predict in general than it is do describe the actual processes of interest of phenomena.
Oh, so statistics can help you to predict who will win an election but can't tell you why or by what margin someone won??
Good to know!
Now go to your kappa- gamma-omega-whatever brotherhood and intimidate some newbies 😉
Incorrect. I said it has a harder time measuring the process of interest. The process-of-interest. That isn't the end result, that is the physical/psychological mechanics that actually cause the results to happen before they happen, not determining who won (you are referring to descriptive statistics, which is different than statistics and in fact is simply a principle of mathematics.)
I assumed you understood the underlying idea of statisitics is 1000% different than what are referred to as 'descriptive statistics' but I shouldn't have.
Second, we don't have uh, erm, fraternities.
Truly, I should stop replying to a troll.
Actually I should say partially correct-and again it isn't that it "can't" but you are correct in your conjecture in part when you said it has a hard time answering the "why" question either afterwards, or more usefully,beforehand.
The reason why is because with any statistical model the underlying assumptions suggest that the behavior of the outcomes follows a certain general characteristic behavior. Now, we can approximate the true behavior by a generally reasonable hypothetical parameterization of a process but no process actually follows (or nigh few do) the actual characterization given to them through parameterized models.
Thus, statistics is not the best at characterizing the actual why of how something happened or will happen but simply what WILL happen. It can however confirm or unconfirm the plausibility of a specific cause of why something happen/will happen.
For example, see the work of Nate Silver. He did not capture WHY it happened (before, or after), butsimply the general of what WILL happen.
http://www.theguardian.com/science/grrlscientist/2012/nov/08/nate-sliver-predict-us-election
[removed]
To fully understand this, or even begin to, takes more than what I am saying here. I should mention though if you actually are interested in what statistics is about that the reason why they statistical model has a hard time detecting exactly the process of interest.
It is because it is very possible to find another statistical model that does just as well but has parameters that have a different interpretation regarding the causality of the predicted outcome.
That was my reference exactly: you can alter models to have different outcomes. Statistics is a tool; it's worth is measured by the accuracy of the model compared to reality.
You can't use models to prove theories - because models and theories are pretty much the same virtual categories of mind.
Hate to say it but if you think I said you can alter models for different otucomes (without doing abd statistics) then you don't understand statistics nor what I am saying. It is almost the reverse.
You can't alter models for different outcomes but different models with different causalities can give you the same general outcome.
Valiant quit trolling nice people. please
Hi Waysted, long time pal. How are you?
tired mate. and you?
voted