
New Scientist - The difference a year makes
Day 1,667, 11:27
•
Published in United Kingdom  •
by
•
by
 •
by
•
by Chemical Chaos
Welcome to the first and introductory edition of New Scientist
New Scientist will look into trends within the erepublik marketplace to hopefully help those who still wish to make a profit from the ever struggling erepublik economy
Looking at prices in the markets today we can see many bargains can be obtained,
13th June (day 1667 11am)
Food
- Q1 0.37
- Q2 0.76
- Q3 1.20
- Q4 1.75
- Q5 2.00
- Q6 2.60
Weapons
- Q1 3.98
- Q2 7.98
- Q3 11.00
- Q4 16.79
- Q5 19.89
- Q6 29.50
WRM 0.06
FRM 0.06
GOLD 2416
Salary 206
Now that today's prices are recognised we can compare them to historical data from back when i first joined in July 2011 (day 1323-1333)
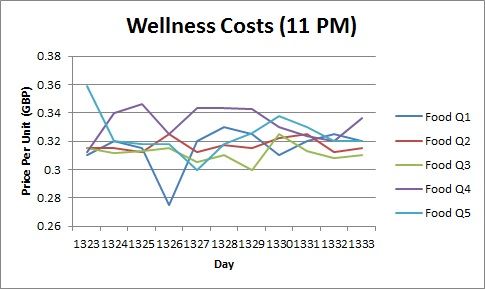
Looking at wellness prices to start with we can see that 1 unit of wellness cost on average 0.32GBP a year ago compared with an average of 0.20 today. It can also be seen in the chart that the best type of food to buy varies and it is always worth looking around to try and get a better deal this was true a year ago and is still true today.
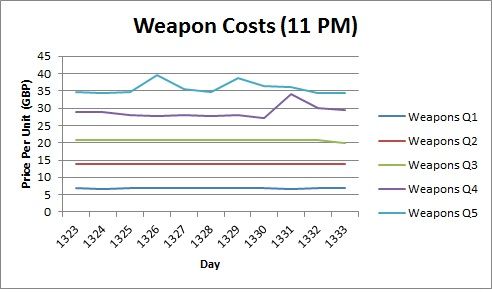
Taking a similar look at weapon prices again we see prices far higher than the prices we currently pay. Prices are also very consistent for Q1, Q2 and Q3 weapons most probably because these aren't produced or used in great amounts, I assume once data is collected for current weapons for Q1-Q4 to be consistent with changes only observed in Q5 and Q6
Its when we come to raw materials that we see some of the biggest changes in price over the course of the year.
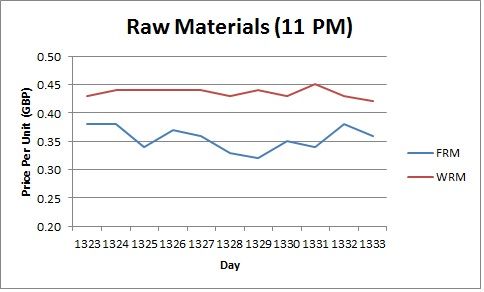
A year ago you can see the price of WRM was around the 0.44 mark which can either be seen as a 628% increaseon today's prices or a loss of 84% for the WRM producers, if we consider some producers have around 100 saltpeter mines (which produce 280 units at 60% bonus) they would have had a daily stock retail value of £12,380 a year ago and the same stock now would be worth just £1,680
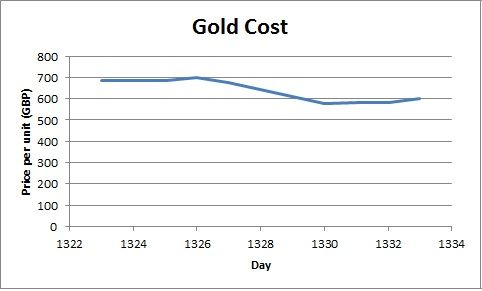
Finally we come to gold, you can pick your jaw back up now, prices really were as low as 600GBP not only that but you could sell currency for 0.002 gold which worked out at 500GBP per gold. This means gold prices have seen a 400% increase making raw materials companies costing gold pointless and actually worth trading in for several saltpeter mines.
Conclusion
The economy has seen prices tumble which is great for buyers and new players without companies however the producers have taken massive cuts in profits in particular WRM merchants who have seen the retail value drop by 84% currency. If we calculate the value of the WRM stock mentioned above in gold at both times the losses are even greater, the retail value in gold a year ago was 20.633 and the same stock now has a gold value of just 0.695g a loss of 96.7%.
Obviously in the year that has passed there have been many new aspects of the game introduced for example Q6 food and weapons, the introduction of training grounds and the addition of Q2/Q3 training. The effects of these on the comparison between market prices has yet to be considered but have no doubt had an effect on prices as players change priorities.
The Future
Future editions of new scientist will look at Q5 and Q6 weapons/food companies (where most of the eUK workforce is contained). looking into expenses and sales prices therefore profit based on average salary, RM costs, retail value and VAT
Hopefully allowing a closer look at the effects of region loss/gain, war and taxation on the profitability of these companies
Thanks for reading
CC
Comments
This is a first attempt so please leave comments and constructive criticism below
I like it, good work. o7
good article
v+s ( :
I think the graphs are a little confusing, it would be nice to see today v last year on them as that is the title. Good work though!
fair point i'll have a look at the graphs and try and improve them when i get a chance hopefully tomorrow
Excellent work!
\o/
V+S because this is a great article concept
=V= ... & S
v+s
pls do the same 😛
http://www.erepublik.com/en/article/my-summer-english-version--2055338/1/20
o7
done george, any improvements ppl want to suggest other than the fixes to the graphs suggested by danie which i will get to soon
V+S Great information here!
parp
so your doing something similar to the 1600index i assume
http://www.erepublik.com/en/newspaper/1600-index-273255/1
i hadn't seen that but it looks an interesting read i thnk i'll sub it, yes after a very quick look at 1600 index i'd suggest they would be similar but based on different economies, may even be worth doing a UK / US comparison one day
o7
How long have the gold prices been so inflated? 2400GBP is outrageous-is it because of all the Raw Material production changes?
When I joined in January this year, Gold was around 1400 (If I remember correctly). By February it was 1650+. I even wrote a comment about it ingame. I agree it's absolutely ridiculous but that's what happens when you get people constantly trying to get better returns than the previous seller. That's why the Food and weapon prices are so ridiculously low to say nothing of the FRM and WRM prices . Everyone trying to sell their produce first.
continued
But this is a great idea. Can't really think of anything to change except possibly expand the scale on the historical food graph. Too close together. Maybe scale it to 0.27 to 0.36
If you tell me where to find the historical info, I could have a look and produce a graph for the whole of the last year for each commodity, or even for as far back as the data goes.
the main reason for the mass plummet in goods prices was the removal of an admin bot that bought surplus stock which kept prices inflated was very handy for sellers and kept prices at what i'd consider to be realistic,
the data is what i collected around the time when i started the game as i was going to publish then, i stopped collecting because it was time consuming and i found an article (by rems2a) that did a similar thing unfortunately as i stopped so did he lol
I'll agree that the graphs were perhaps a bit crampt. Good article though.
Great article. v+s
i've expanded the wellness graph, i tried to add the points from the current data but to fit them on the same graphs shank the scale too far as there is such a difference in prices
You've gained both my vote and subscription. It's nice to keep on top of the market.
Just repeating, but the graphs are a tad compact. Great article though. Fantastic to see you getting into the newspaper industry.
awesome article V+S!